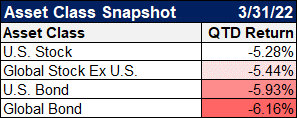
FROM THE OPENING DAYS OF 2022, investors were taken on a wild ride during a first quarter that featured wide swings in stock, bond, and commodity markets around the world. Stocks and bonds, which often move in opposite directions, both finished in the red, an occurrence not seen since the first quarter of 2018.
Source: YCharts
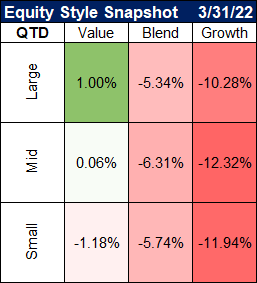
Within the equity styles, the gap between value and growth was significantly in favor of value. The declines in growth stocks were sparked by a combination of high valuations for many names and the jump in interest rates. As we explained in last quarter’s newsletter, since many growth stocks have valuations based on future profits, higher rates mean that future earnings are worth less today. This has a negative impact on the stock price for many companies that have been experiencing high growth over the last few years with little to no profit to show for it. Greystone’s managed strategies have been tilted toward value stocks since the better part of last year in anticipation of a rising interest rate environment.
Source: YCharts
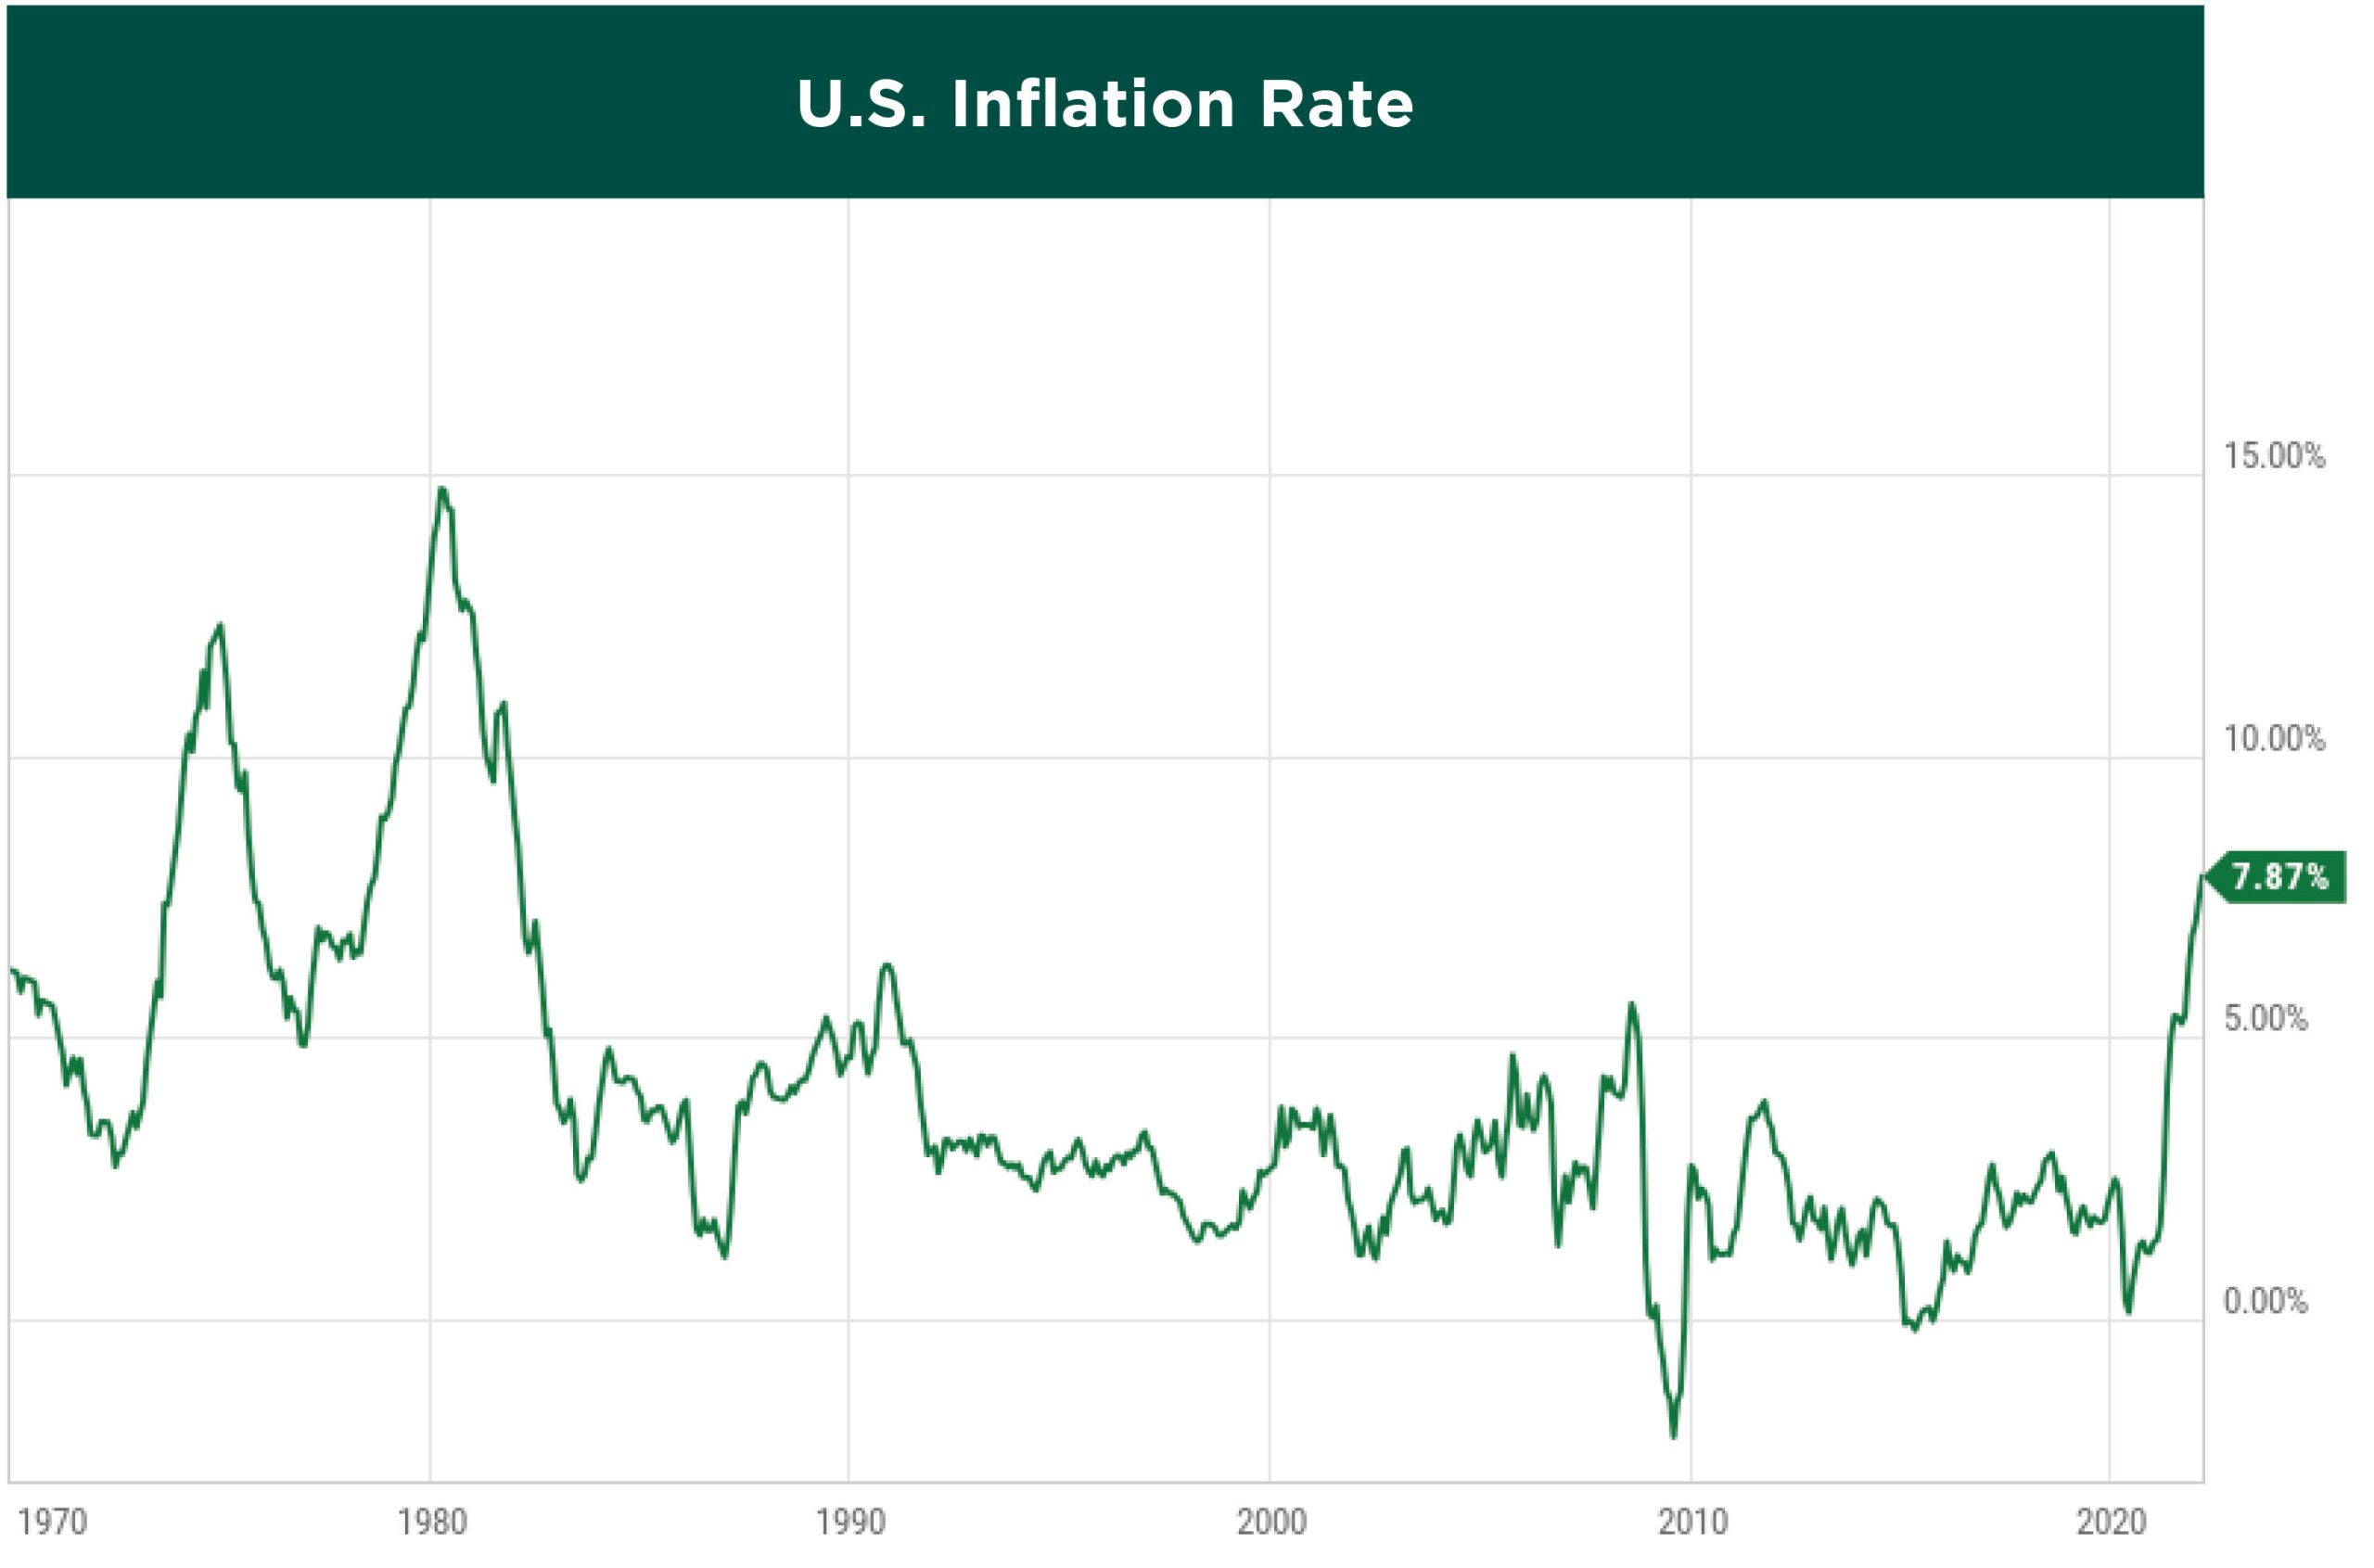
U.S. equities closed out their first quarterly loss in two years due initially to soaring inflation and the Fed’s hawkish pivot. Economic measures of inflation had already reached 40-year highs in the previous quarter, with the November CPI (Consumer Price Index) registering +6.8%, before climbing higher in consecutive months to the most recent reading of +7.9% in February.
Source: YCharts
As stocks were taking a dive as the market reassessed the potential of the Federal Reserve setting out a more aggressive path for interest rate hikes to help curb inflation, bond prices also slid, sending yields higher. In fact, bonds had their worst quarter in 20 years, with most intermediate-term bond indexes down at least 5% and long-term bond indexes down at least 10%.
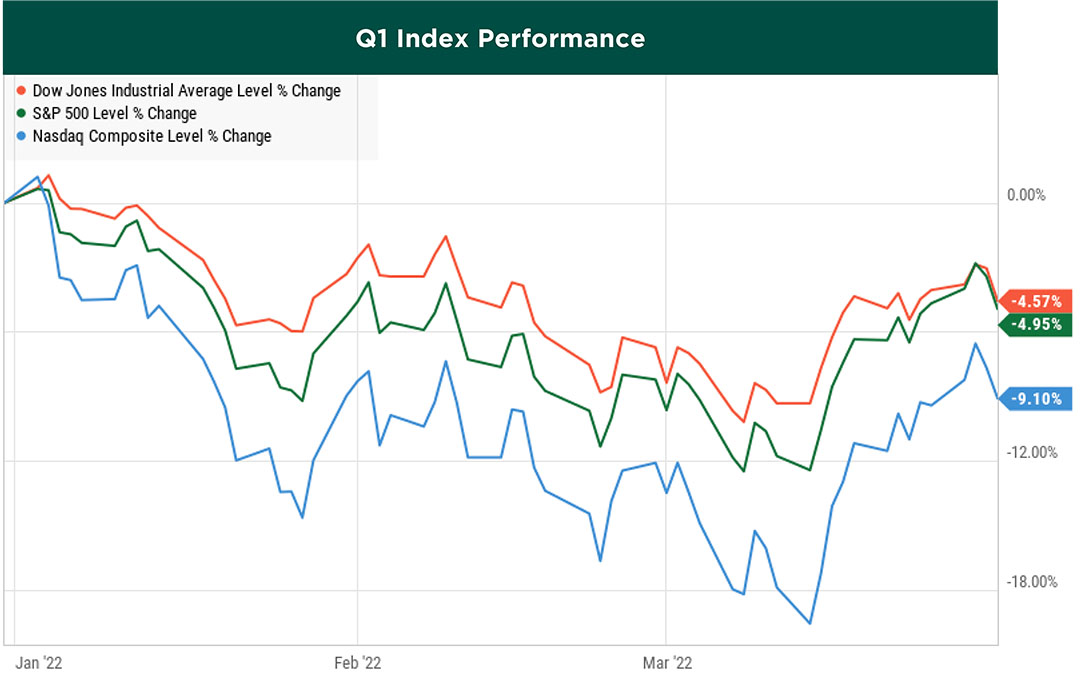
Just as markets seemed to be stabilizing in February, Russia invaded Ukraine, sending oil and other commodity prices soaring. Stocks fell into official correction territory, dropping more than 10% from their all-time highs. The second half of March saw a nice rally and stocks regained some ground, but ultimately, the three major indexes ended in negative territory.
Source: YCharts
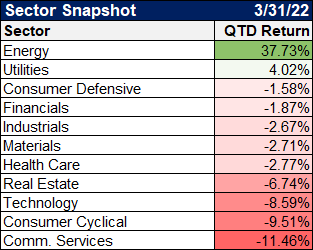
Looking at the sector performance in the first quarter, only Energy and Utilities finished positive, with the former having its best quarter since its inception in 1989, due to the soaring oil and gas prices.
Source: YCharts
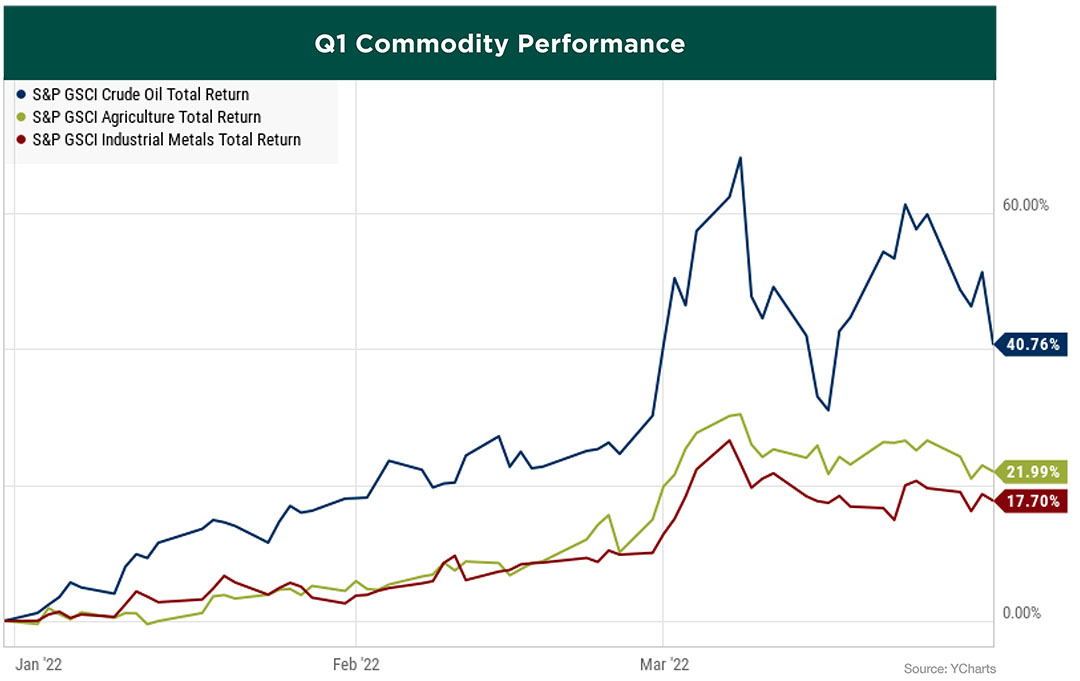
Oil prices were already on the rise as demand from a global economy recovering from the pandemic-induced recession outstripped supply. After Russia, a major oil and gas exporter, attacked Ukraine, oil hit a 14-year high of $125 per barrel. That was up from $75 at the start of year as traders anticipated that sanctions on Russia would cut supply. The price retreated to $100 to end the quarter as supply fears receded slightly for the time being, but even so, oil saw a massive quarterly gain of 33%.
Energy hasn’t been the only corner of the market surging as of late. Metals and agricultural commodities have as well. Even before the Russian invasion, money was pouring into commodities as a potential inflation hedge. With global economies still adjusting to Covid’s impact on supply chains and the shift in consumer spending, the escalating Russia/ Ukraine conflict only added fuel to the inflation fire due to the future uncertainty regarding the exports of important natural resources in both countries.
Source: YCharts
The commodity market, from crude oil and natural gas to industrial metals and agriculture, has historically demonstrated tremendous volatility. While geopolitical risk is difficult to predict, we believe commodity prices are likely to stay at elevated levels. The Greystone investment team has taken advantage of these conditions since the beginning of the year by adding multiple portfolio positions to increase our exposure to commodities.
Regarding energy costs, we haven’t seen any significant measures put in place yet to alter our expectation that oil and gas prices will continue to remain elevated. The recent decision from the Biden Administration, as well as the International Energy Agency, to release millions of barrels of oil over the next 6 months from strategic petroleum reserves will not have a lasting impact on supply constraints. This will most likely only have a temporary effect on prices and eventually will need to be replaced. Furthermore, when nations start buying crude to replenish their stockpiles this could very well lead to prices increasing once again. Until U.S. oil producers start boosting production or until there is a decision from the countries of OPEC to boost production, there isn’t much reason to think that prices will significantly decline in the long term.
TOPICS OF INTEREST
Inflation & Possible Hedges
It’s almost impossible to turn on the news or read anything involving the markets or economy without hearing or seeing “inflation” being discussed. Inflation is defined by the rate at which the value of a currency is falling and, consequently, the general level of prices for goods and services is rising. This means that for any given unit of currency you are able to buy fewer goods and services as time goes on.ne of the Federal Reserve’s chief responsibilities is to monitor and control inflation. The primary way they attempt to manage this is by increasing the Federal funds rate, which is the rate banks can borrow money from the government. As the Fed increases rates, this inherently increases interest rates charged by banks, ultimately slowing spending, and forcing prices lower.
The dilemma the Fed currently faces is deciding the proper pace and extent of the rate hikes that the economy can handle. If rates are increased too quickly, before the economy is ready for it, the realized effect of the interest rate increase can be too much, and the economy could become strained and fall into a recession. These decisions also have an effect on the yield curve which will be discussed later on.
The Fed aims to keep the inflation rate around 2%, but as you can see from the chart, the average inflation rate since 1970 is just about 4%, skewed a bit by the high inflation environment during the 1970s.
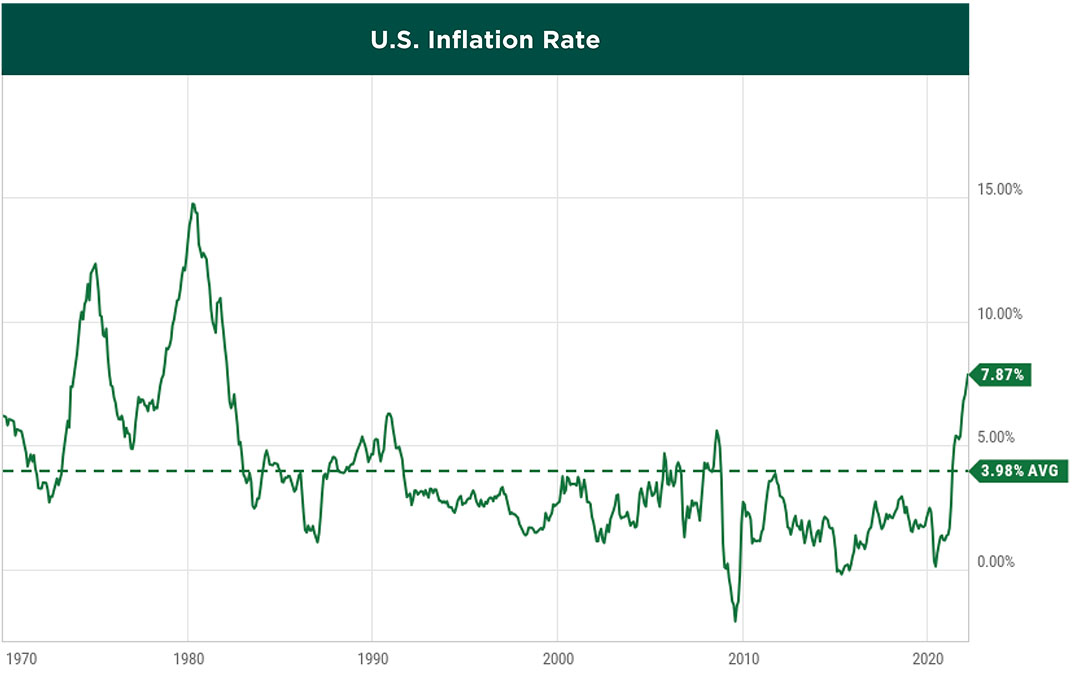
Even if you remove that period from the equation, the average inflation rate is still 3.25% since 1980. Therefore, on average, the cash that you hold loses about 3% buying power per year. With the current rate, your cash is losing almost 8% in value. Hence, having your hard-earned money sitting completely in cash right now doesn’t make much sense for long-term goals, in our opinion.
The U.S stock market on the other hand, using the S&P 500 index as a barometer, is averaging just over 12% per year since 1980, assuming all dividends were reinvested. Therefore, the average inflation-adjusted return is about 8.75% per year, and about 6.75% if we include the 1970s.
So, with inflation at a level not seen in 40 years, what can investors do to help protect their savings from losing value? As the previous figures show, staying invested in the overall stock market has historically been a great option over the long term.
In the short term, while inflation is running hot, certain areas of the market should fare better than others. Some asset classes that historically provide the best protection against inflation are:
Real Estate – Inflation means higher prices for real assets, one of which is real estate. This means higher property values. Landlords can also directly pass on inflation costs to tenants in the form of higher rents. This applies to both physical property owners and REIT investors.
Commodities – Similarly, commodities are tangible assets that are used in the production of other goods and services – oil, gas, copper, livestock, etc. As with real estate, the value of these items usually goes up with inflation.
TIPS – Treasury Inflation Protected Securities (TIPS) are U.S. Treasury bonds that are indexed to the CPI to explicitly protect investors from inflation. Twice a year, TIPS payout at a fixed rate. The principal value of TIPS changes based on the inflation rate, and so the rate of return includes the adjusted principal.
Stocks – As mentioned above, historically a good long-term option to outpace inflation has been to stay invested in the broad stock market. However, during periods when inflation is higher than normal, as is the case right now, there are some specific groups of stocks that should be targeted. We believe the best companies to invest in during periods of rising inflation are the ones that have pricing power, so as their costs rise, they can raise prices on their customers. Stocks in defensive sectors like Consumer Staples and Utilities are examples that tend to weather inflation better than others.
Greystone has exposure to each of these asset classes to help reduce the negative impact of inflation, and we plan to remain this way until we see evidence that the rising inflation is getting under control.
The Yield Curve & Impact of Inversion
The U.S. government pays interest to borrow money, and that interest rate fluctuates constantly on the open market. Typically, the yield curve slopes upwards because investors expect more compensation for taking on the risk that rising inflation will lower the expected return from owning longer-dated bonds. Therefore, the longer it takes to get paid back, the higher the interest rate. At least that’s how it works during normal times when the economy is stable.
Whereas a rising yield curve typically signals expectations of stronger economic activity, higher inflation, and higher interest rates, a flattening yield curve can mean the opposite; investors expect rate hikes in the near term and have lost confidence in the economy’s growth outlook. And if things don’t get better, the yield curve may even become inverted.
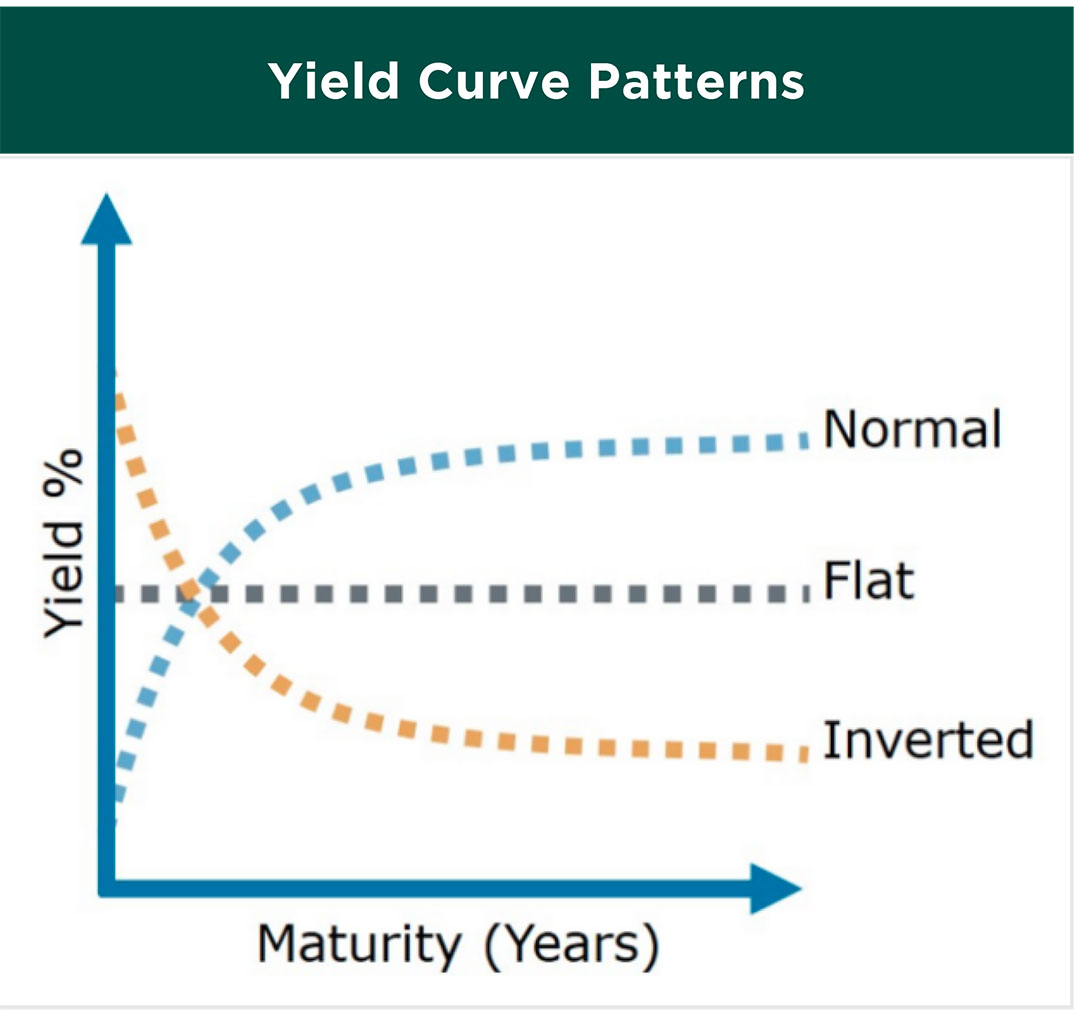
A yield curve inversion happens when the interest rates on long-dated Treasurys are lower than those on short-dated Treasurys. When investors see the economy starting to struggle, they start to demand higher interest payments on short term bonds. That’s because bonds are less likely to be paid back when economies are in trouble, and the demand for money now is greater than in the future, a sign that the economy is slowing down. That tends to be a good signal that a recession is about to happen.
The yield curve has inverted before every recession since the 1950s. The Federal Reserve has even said that an inversion is a reliable predictor for an economic downturn. Looking at the following chart showing the difference between the 10- year and 2-year government bond, it went negative, or inverted, before every recession. This 2-10 Treasury spread is the most common indicator of the steepness of the yield curve. Researchers at the Fed say that’s largely because the interest rate on a 10-year note reflects long-term perceptions of the economy, while interest rates on a 2-year note are largely a reflection of monetary policy. When monetary policy is pushing short-term interest rates higher, but investor sentiment is falling, you can see the yield curve invert.
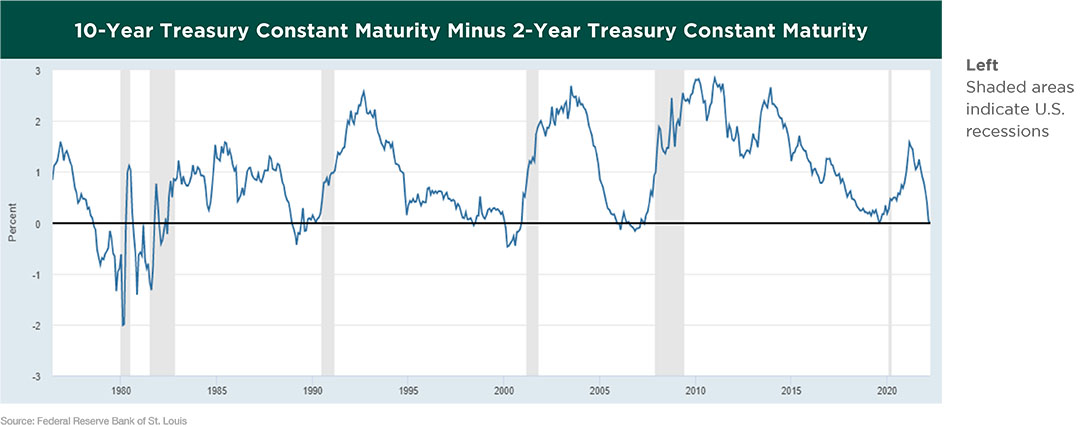
Yields of short-term U.S. government debt have quickly been rising this year, reflecting expectations of a series of rate hikes by the U.S. Federal Reserve, while longer-dated government bond yields have moved at a slower pace amid concerns that policy tightening may hurt the economy. Consequently, the difference, or spread, between the rate on 2-year and 10-year notes has been compressing pretty consistently for most of 2022, and in fact, just recently turned negative on the last day of March.
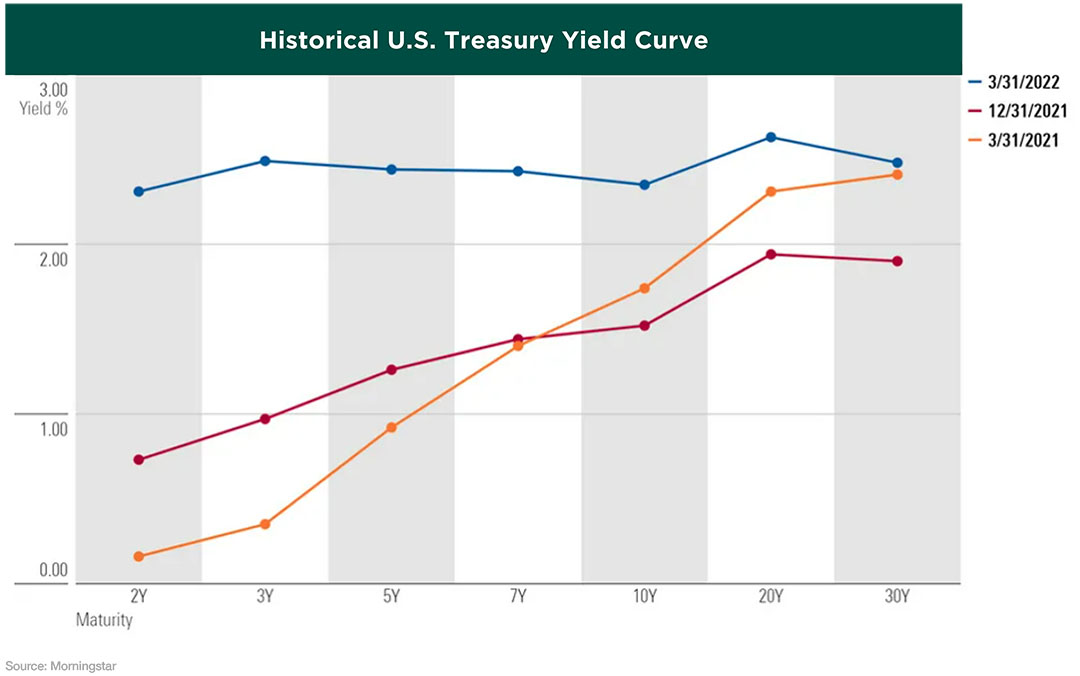
This is a result of continued high inflation, increasing expectations for the Fed to continue raising rates, worsening economic sentiment, and worries about the conflict in Ukraine. While rate increases can be a weapon against inflation, they can also slow economic growth by increasing the cost of borrowing for everything from mortgages to car loans. Just think of what it means for a bank; the yield curve measures the spread between a bank’s cost of money versus what it will make by lending it out or investing it over a longer period of time. If banks can’t make money, lending slows and so does economic activity.
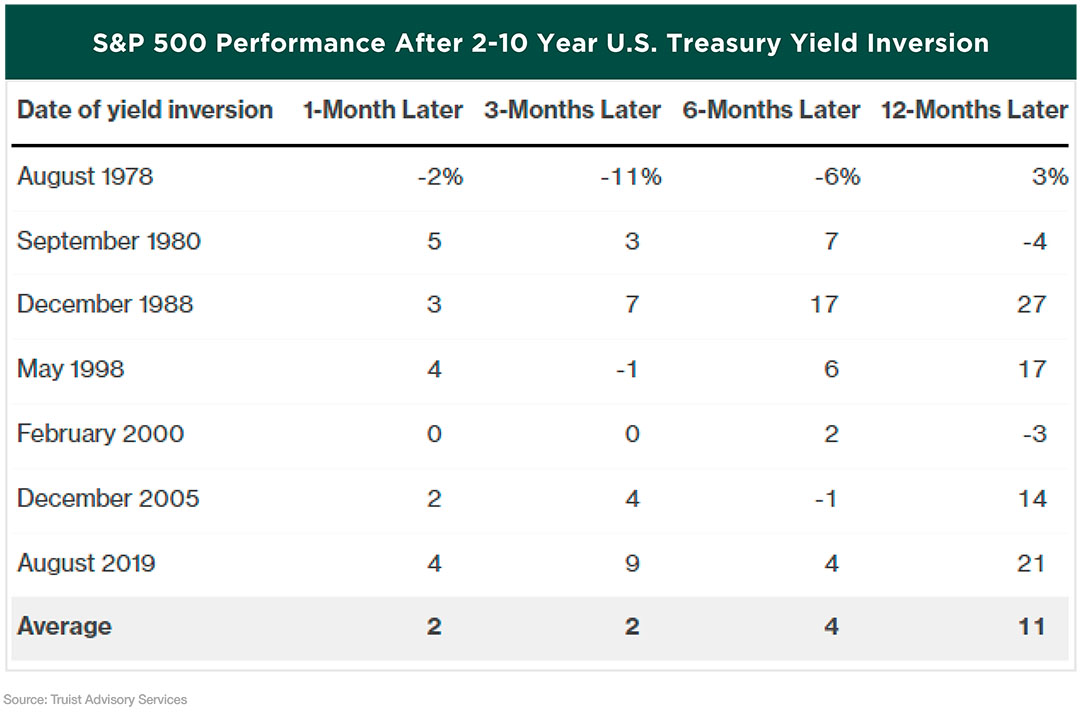
One hopeful caveat for investors, and anyone who doesn’t want to see a contracting U.S. economy, is that an inversion doesn’t mean an immediate U.S. recession. Since 1955, the time between an inversion and a recession has varied from 6 to 24 months, and stocks typically perform well during that time, averaging 11% in the year after the inversion occurs since 1978. To be clear, an inverted yield curve doesn’t cause a recession; it’s just a warning sign. So, just because an inversion has occurred across several maturities, it doesn’t necessarily mean a recession has to happen. Probably a more important signal is the length of time the curve remains inverted. As of this writing (April 7th), the 2-10 Treasury spread has turned back positive. Even if a recession does occur down the road, based on historical averages, there is a small probability of it happening in 2022.
IN CONCLUSION
This quarter’s newsletter probably didn’t do a lot to instill confidence in the current state of the market. However, even though the war in Ukraine, inflation, an activist Fed, and the supply-chain crisis have dominated the headlines as of late, this has caused a number of positive things to be overlooked. The pandemic has taken a backseat for starters.
Restrictions continue to be lifted and the vast majority of people are ready to get back to their normal lives. We have a strong labor market, strong consumer demand, strong corporate earnings, and a strong economy, which is exactly why the Fed feels it has the ability to raise rates right now. The market pullback this year has also provided opportunities to add stocks at better prices, which should pay off down the road. Another round of earnings is about to get underway, which will give us a signal to the health of underlying business activity during this complicated time.
All things considered, we at Greystone feel confident in our decision-making ability and look forward to the continuing challenge of effectively navigating this market.
PLEASE SPEAK WITH YOUR WEALTH ADVISOR IF YOU HAVE ANY QUESTIONS OR WANT TO REVIEW YOUR PORTFOLIO TO BE SURE THAT YOU ARE IN THE MOST APPROPRIATE STRATEGY TO HELP YOU ACCOMPLISH YOUR LONG-TERM GOALS.

SINCERELY,
THE INVESTMENT TEAM AT GREYSTONE FINANCIAL GROUP
DISCLOSURES
There is no guarantee investment strategies will be successful. Investing involves risks including possible loss of principal. There is always the risk that an investor may lose money. A long-term investment approach cannot guarantee a profit.
All expressions of opinion are subject to change. This article is distributed for educational purposes, and it is not to be construed as an offer, solicitation, recommendation, or endorsement of any particular security, products, or services. Investors should talk to their Wealth Advisor prior to making any investment decision.

