GLOBAL MARKETS DECLINED AGAIN in the third quarter as inflation remained near multi-decade highs, geopolitical tensions escalated further, and the Federal Reserve continued to aggressively hike interest rates signaling future rate increases will be larger than previously expected.
The quarter took investors on a roller coaster ride, starting with a solid rebound in stocks and bonds in what became an impressive summer rally; the S&P 500 gained 17% and the Nasdaq even entered a new bull market gaining 23%. The rally was driven by resilient corporate earnings, signs of a possible peak in inflation, and hints from the Federal Reserve that the end of the rate hiking cycle may come sooner than markets initially expected, stoking hopes of a soft landing for the economy.
But ultimately, the move higher in July and early August was nothing more than a “Bear Market Rally” as in late August, Fed Chair Jerome Powell dismissed the idea of a looming Fed pivot to less-aggressive policy, dashing hopes that the end of the rate hike cycle was in sight.
The selling continued in September, as the August CPI report showed a slight increase in prices, implying that while inflation pressures had potentially peaked, inflation was not rapidly declining towards the Fed’s target, meaning rates would likely stay elevated for the foreseeable future. Then, at the September Federal Open Market Committee (“FOMC”) meeting, the Federal Reserve hiked interest rates by 75 basis points for the third consecutive time and signaled rates will continue to rise to levels higher than previously expected.
The combination of sticky inflation, expectations of numerous future Fed rate hikes, rising geopolitical tensions, and currency and bond market volatility weighed heavily on stocks and bonds into the end of September, as both markets finished the quarter near the lows for the year.
The following year-to-date asset class and sector returns show just how difficult it has been for investors to navigate the market this year.

THIS HISTORICALLY BAD YEAR CONTINUES
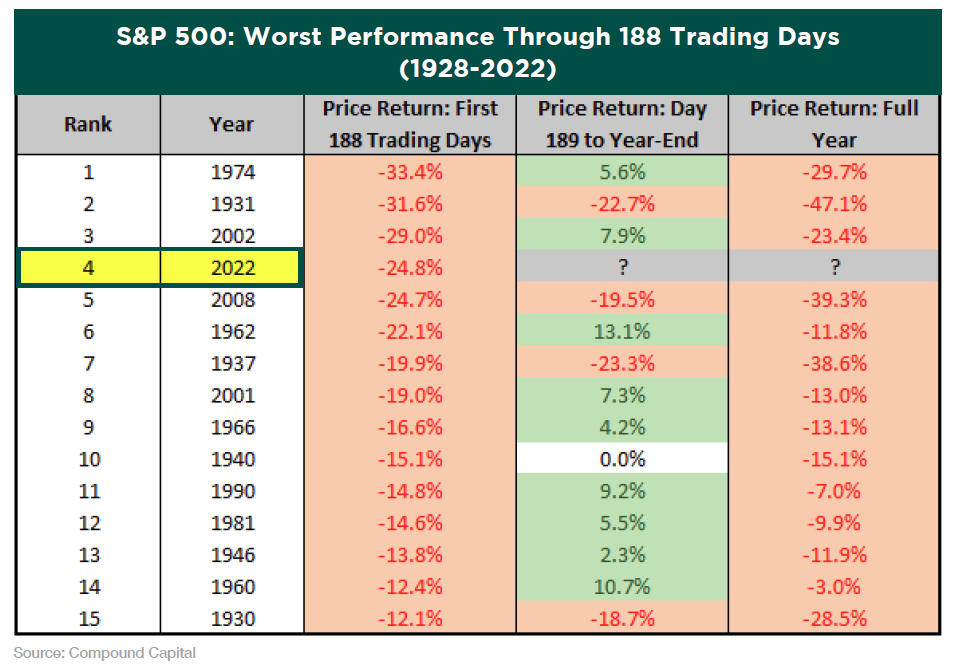
In last quarter’s newsletter, we discussed just how historically bad of a year it has been for both stocks and bonds. Since there hasn’t really been any improvement since then, we don’t need to go over those statistics again. We will add a few additional charts this time around though to further emphasize the magnitude of how painful this year has been for investors.
The Greystone investment team urges you to go back and read the previous newsletter to see why it is so important to stay invested during difficult times such as these.
This year has been the fourth worst start for the S&P 500 through the first 188 trading days, since 1928.
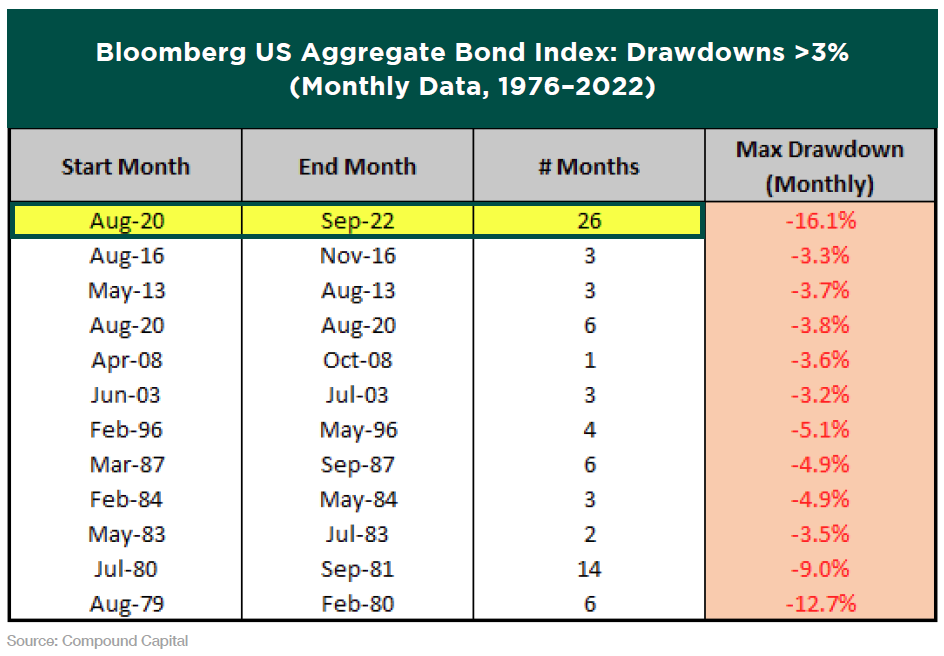
In addition, since the Bloomberg US Aggregate Bond Index’s inception in 1976, the 16% decline over the last 26 months is the longest and largest drawdown in history for the US bond market.
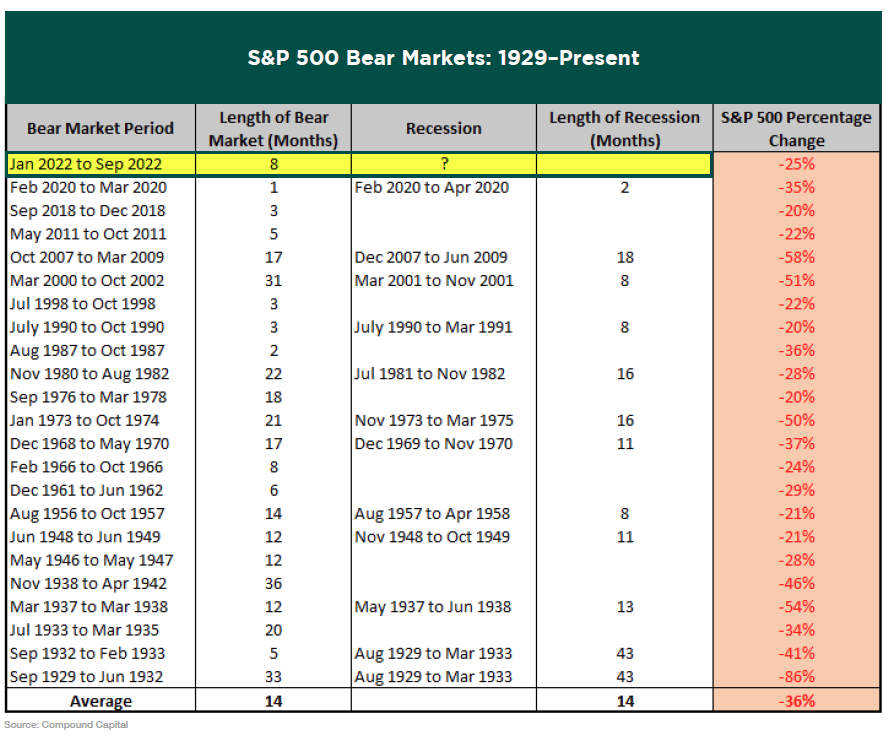
The current bear market at 8 months is now the longest we’ve seen since the 2007-09 period. The average length of a bear market since 1929 is 14 months.
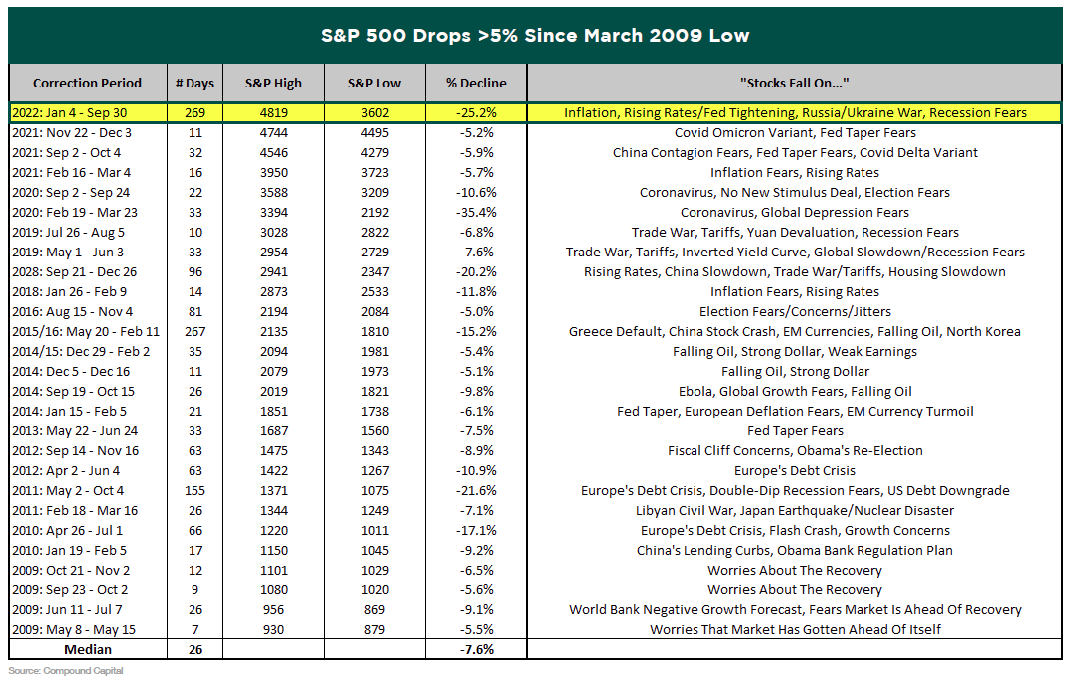
At 269 days and counting, this is now the longest S&P 500 decline over 5% (peak to trough) since the March 2009 low.
WE WILL GET THROUGH THIS
Nobody likes to lose money. Humans are wired for loss aversion, which means most of us experience losses asymmetrically more severely than equivalent gains. For instance, the pain of losing $100 is often far greater than the joy gained in winning the same amount. Some studies suggest that the psychological pain of losing is about twice as powerful as the joy we experience when winning.
For example, if you are a client in Greystone’s Strategic Growth strategy, there is a good chance that you are experiencing this right now. Growth stocks, growth funds, and money managers that run growth-tilted strategies have been hit particularly hard this year.
Growth stocks are heavily reliant on capital for future business expansion, and investors are willing to pay more based on their higher growth rate of future earnings and cash flow. During periods of low interest rates, growth stocks can obtain capital cheaply as capital and growth is easier to come by. When interest rates rise, capital gets more expensive, which inevitably slows a company’s growth, and its ability to secure low-cost debt financing gets more difficult as well. Higher interest rates also mean future cash flows become less valuable, effecting the stock price valuation. Throw in other issues such as pandemic-induced supply chain disruptions, international conflicts, and ongoing lockdowns in China, and it’s a recipe for disaster for many high-growth technology stocks, which make up a big part of growth indexes and portfolios.
Greystone is well aware of the shock and pain that is felt when some of our clients look at their quarterly statements and see they are down 15%, 20%, or even close to 30% this year. If you are invested in the stock market, you have to be mindful that however rare they are, there will be years like this. Warren Buffet has famously said, “Unless you can watch your stock holding decline by 50% without becoming panic-stricken, you should not be in the stock market.” Obviously, we don’t want to see the market go down 50%, but investors need to have a long-term mindset if they are in a more aggressive strategy which may have volatile swings from year to year. This is best illustrated by looking at the historical returns for the benchmark of Greystone’s Strategic Growth strategy (MSCI All Country World Index) and another popular growth index (Russell 1000 Growth).
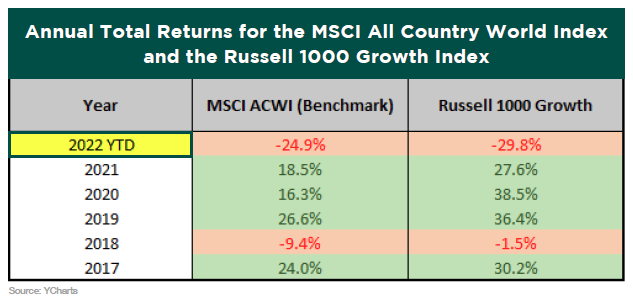
As you can see, the year-to-date return for the benchmark through September is -24.9%. Compare this to the previous 5 years, where the index had outstanding returns in 4 of those periods. The magnitude of the returns is even greater for the Russell 1000 Growth index. The year-to-date performance very likely causes one to feel more pain now than the joy experienced being up in prior years. But that goes to show you that investment performance should be looked at over a longer period, often 3 to 5 years at a minimum. Please note that because investors cannot invest directly in unmanaged indices, the returns do not reflect the deduction of fees which would otherwise have the effect of decreasing the historical performance results.
Greystone attempts to take advantage of the current bear market, which has provided opportunities to buy stocks at valuations we haven’t seen in years. However, just because these stocks are at attractive price points, it doesn’t mean that there isn’t additional downside to come. But buying into them now should payoff down the road when we do see the market recover, which history shows will eventually happen, and most likely at a vigorous pace. That is why we have been strategically rebalancing our strategies throughout the year to keep buying into the holdings at lower prices. Dollar-cost averaging is one of the most important things investors can do during a market like this.
Again, please reference last quarter’s newsletter for additional reasons as to why it so important to stay invested. However, if you believe you are in a Greystone strategy that isn’t suitable for your risk-tolerance or time horizon, or just want additional information on any one of our strategy objectives, please schedule an appointment with your Wealth Advisor as they will be happy to discuss this with you.
MIDTERM ELECTIONS
With the midterm elections only a couple weeks away, it is worth considering the implications of any change in government control. Currently, the Democrats have a slim majority in the House of Representatives while the Senate is split 50/50. 35 Senate seats are up for election, 21 currently held by Republicans and 14 held by Democrats, while all 435 House seats are up for election. Over the past 22 midterm elections, the president’s party has lost an average 28 seats in the House of Representatives and 4 seats in the Senate. Only twice has the president’s party gained seats in both chambers.
Why is this usually the case? First, supporters of the party not in power usually are more motivated to boost voter turnout. Also, the president’s approval rating typically dips during the first two years in office, which can influence swing voters and frustrated constituents.
At the time of this writing, the odds are favoring the Republicans to take control of the House. Regarding the Senate, although it should be a very tight outcome, it is looking more and more likely that the Democrats will be able to retain control. Ultimately, it’s policy not politics that has the most impact on the economy and markets. Therefore, at a very simple level, political pundits suggest we can expect the following depending on the outcome:
- If Republicans gain control of either body of Congress, we’ll see relative legislative gridlock which will limit major changes to tax and spending Investors generally think gridlock is good because it means less legislative risk. And anytime there’s less macro uncertainty, it tends to boost investor sentiment.
- If Republicans gain control of both the Senate and House, President Biden’s agenda will face a strong headwind, but it could also provide opportunity for some limited bipartisan
- If Democrats retain both the Senate and House, we’ll likely see significant changes to taxation and continued spending, plus further passage of the Democrat’s policy agenda, including unpassed components of the Build Back Better
What do these possible outcomes mean for the stock market? The current election projections are lining up in favor for the best market outcome, at least based on historical data.
As you can see below, a Democratic president with a split Congress has provided the highest average annual return for the S&P 500, while a Democratic president and Republican Congress provides the next highest.
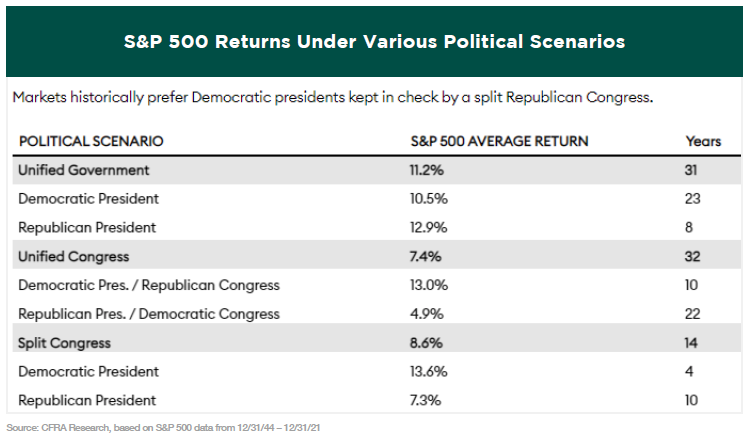
And while these are the two most likely election outcomes, past performance doesn’t guarantee anything going forward. But at least this does provide some reason for optimism.
This year has been one of the worst on record for the stock and bond market due to a number of factors. Worries about inflation, the Russia/Ukraine war, ongoing global lockdowns, supply chain delays, and the Federal Reserve’s tightening monetary policy are just some of the reasons. The fact that this is also a midterm election year, which has historically been the stock market’s worst performing period in a presidential cycle, just makes matters worse. You can see from the following chart just how different the average trajectory of equity returns throughout midterm election years compare to non-midterm election years.

Specifically, the 6 months leading up to the midterms is typically the toughest on the market, with Q2 and Q3 averaging -1.8% and -0.5%, respectively.
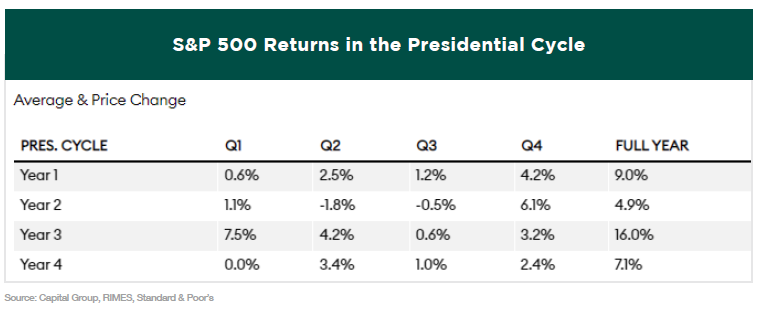
The silver lining for investors is that although the market can be rough leading up to the elections, stocks usually surge shortly after. The fourth quarter of midterm years and first quarter of the following year boast the two strongest returns of the entire presidential cycle, rising 6.1% and 7.5% on average, respectively.
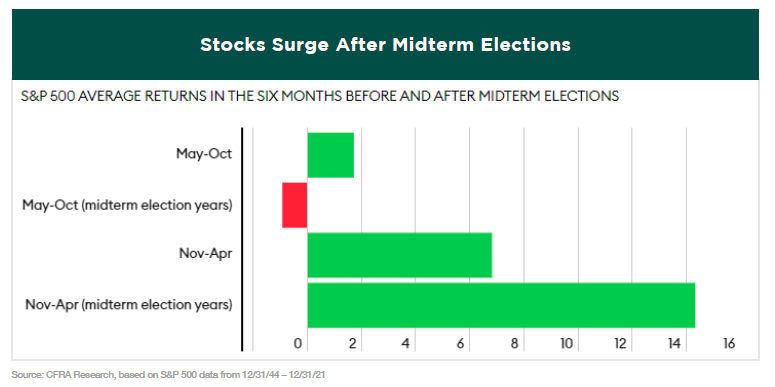
Here’s another reason for optimism. Since 1950, there have been 18 midterm election cycles, and in the twelve months following each of those cycles, the stock market has had positive returns every single time. In fact, the average one-year return following a midterm election is 15.1%. That’s more than twice the return of all other years during a similar period.
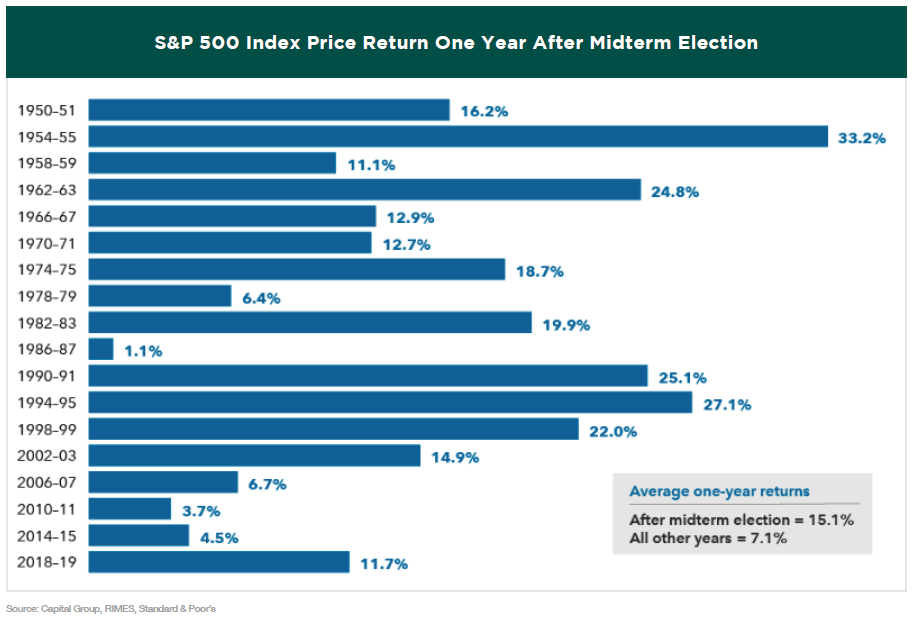
Of course, every cycle is different, and elections are just one of many factors influencing market returns. For example, over the next year investors will need to weigh the impacts of a potential U.S. recession and global economic and geopolitical concerns. But at least it is a little comforting to know that history is in the market’s favor once we get through the midterm elections.
IN CONCLUSION
Bear markets are tough. But as we pointed out in last quarter’s newsletter, the average bull market historically lasts over 4 times as long as the average bear market. Times are going to continue to get harder for people across the country, and many parts of the world, as we are staring down a possible global recession. Only time will tell if the Fed can successfully produce a soft landing, but history isn’t on their side.
Although it is very likely there will be more financial pain to come, there is an extremely good chance that the stock market will recover before the economy does. Currently, the single most important issue facing the stock market and the economy is inflation. We expect there to be a few more rate hikes before the Fed can pause and see the full impact of how the rate increases have trickled through every corner of the economy and the degree to which inflation comes down. When the Fed does pause, and eventually pivots from their hawkish tone, the market should get a huge bounce, and you don’t want to be sitting on the sidelines when that happens.
In the meantime, the market may continue to be volatile with sharp rallies and sharp pullbacks. This can cause investors to give into their emotions and lead to irrational decisions. Let Greystone do the work and take the emotion out of investing for you. We try the best we can to align our portfolios to get defensive during uncertain times and more aggressive when market conditions are favorable. We are here for you and welcome helping you through these difficult times.
PLEASE SPEAK WITH YOUR WEALTH ADVISOR IF YOU HAVE ANY QUESTIONS OR WANT TO REVIEW YOUR PORTFOLIO TO BE SURE THAT YOU ARE IN THE MOST APPROPRIATE STRATEGY TO HELP YOU ACCOMPLISH YOUR LONG-TERM GOALS.

SINCERELY,
THE INVESTMENT TEAM AT GREYSTONE FINANCIAL GROUP
DISCLOSURES
There is no guarantee investment strategies will be successful. Investing involves risks including possible loss of principal. There is always the risk that an investor may lose money. A long-term investment approach cannot guarantee a profit.
All expressions of opinion are subject to change. This article is distributed for educational purposes, and it is not to be construed as an offer, solicitation, recommendation, or endorsement of any particular security, products, or services. Investors should talk to their Wealth Advisor prior to making any investment decision.

