AT THE START OF 2022, the future looked bright. Corporate earnings were strong, the economy was growing, stocks were near record highs, the COVID threat was shrinking, and the Federal Reserve was planning only a gradual rise in interest rates. That bright future fizzled away shortly after, and at the mid-point of the year we are now dealing with a bear market in stocks, the biggest drop ever in bond prices, the highest inflation in decades, the sharpest rise in interest rates in years, and the most destructive conflict in Europe since World War II.
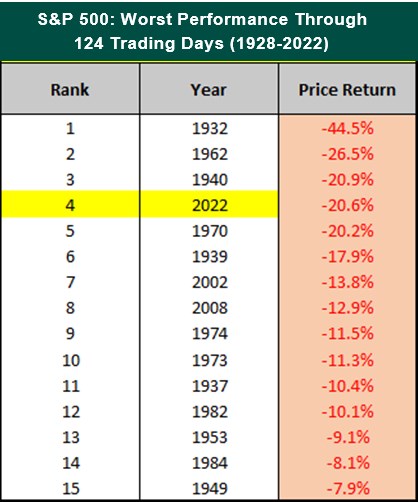
These factors have led to the stock market having the worst start to a calendar year since 1970, down 20.6% in the first half.
Source: Compound Capital
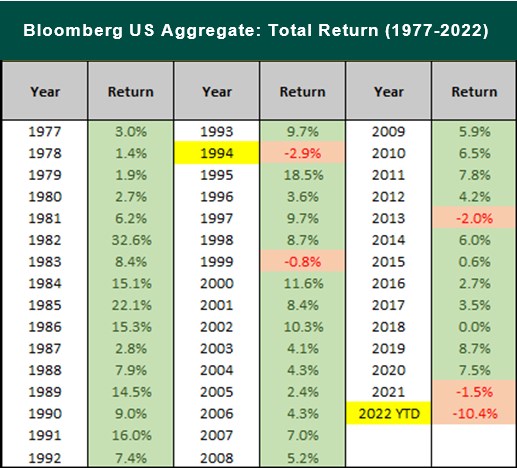
Not only did the stock market take a beating, but the broad bond market, which has historically been a safe haven, is on pace for its worst year in history, down 10.4% in the first half. Entering the year, the 2.9% decline for bonds in 1994 was the largest ever recorded since the origination of the Bloomberg US Aggregate Index.
Source: Compound Capital
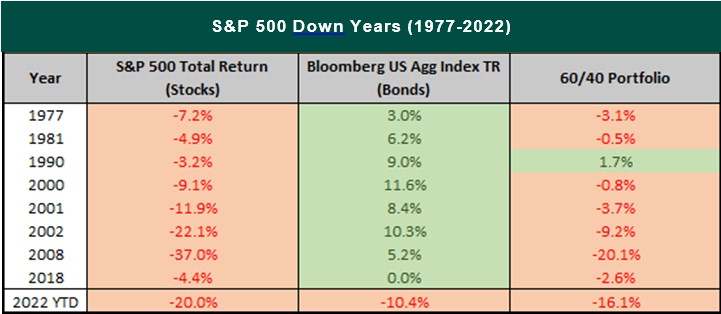
This rare occurrence where both the equity and fixed income markets decline together has left investors with virtually nowhere to hide. Over the past 45 years, the bond market has never finished negative in the same year that the stock market has. This has helped investors cushion their losses in down years for stocks, as shown below for the tried-and-true 60/40 stocks-to-bonds investment strategy that has historically worked out well.
Source: Compound Capital
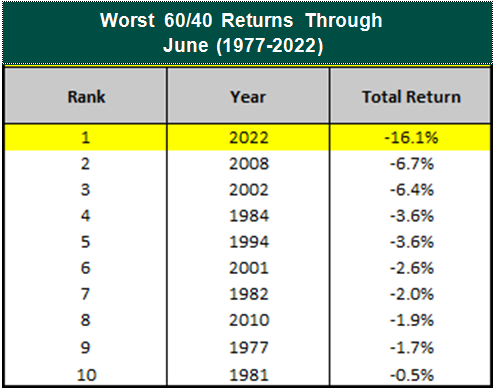
To further illustrate how bad it’s been for both stocks and bonds, we can look at the first half performance over the same time period. As you can see, this year has been the worst start for the 60/40 portfolio, and it’s not even close.
Source: Compound Capital
For a full calendar year, 2008 provided the biggest annual decline, losing 20.1% for the 60/40 portfolio.
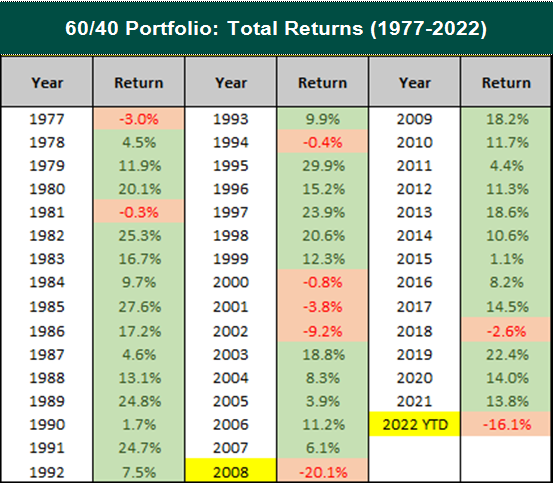
Source: Compound Capital
Hopefully, 2022 can avoid eclipsing that level. And there is reason for hope, if we expand on the data presented in the first table of this newsletter. If the second half performance is added for the five worst years, excluding 2022, we can see that the market rebounded in each of those years for an average second half return of 24.3%
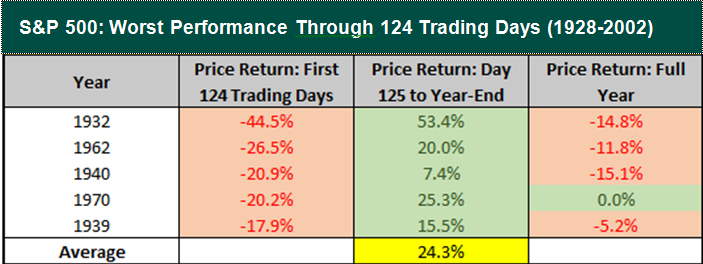
Source: Compound Capital
Of course, this doesn’t mean that 2022 will follow suit, but it does provide some support for staying invested in the market to avoid missing out on a potential rebound.
Staying Invested
Greystone is aware that this is a very tough time for our clients, many of whom are concerned about where the market is headed. The average investor lets their emotions get the best of them and tries to time when to get in and out of the market. A majority of the time this doesn’t work out in their favor, and you can see from the following chart that the average investor has significantly underperformed the stock market over the past 20 years.

Source: DALBAR Inc
Despite strong index returns over time, the average investor has underperformed a basic, indexed 60/40 portfolio by an annualized rate of 3.8%. On a $100,000 initial investment from the start of 2002 through the end of 2021, that adds up to over $200,000 of missed gains!
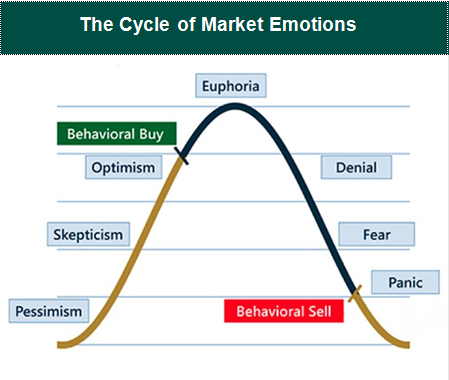
The reason for this is because most investors fall prey to the cycle of market emotions. We could go into detail about each stage of the cycle, but the main point is that most of the investing public buys near market highs when everything seems to be going well and sells near market lows when there seems to be nothing but negativity surrounding the markets.
We believe that now is precisely the wrong time to abandon the market and go to cash. It’s always darkest before dawn, and the average investor who leaves the market rarely comes back in at the right time. Negative headlines can persist for long periods. The typical investor usually waits for good news, and by the time that happens, they’ve often missed some of the strongest days of market performance. Missing out on those big days can make a significant difference in their long- term return.
The following chart illustrates what has happened when an investor missed the 10, 20, and 30 single best days in the market over the past 20 years. If missing the 10 best days sounds implausible, consider that in the past 20 years, seven of those best days happened within about two weeks of the 10 worst days.
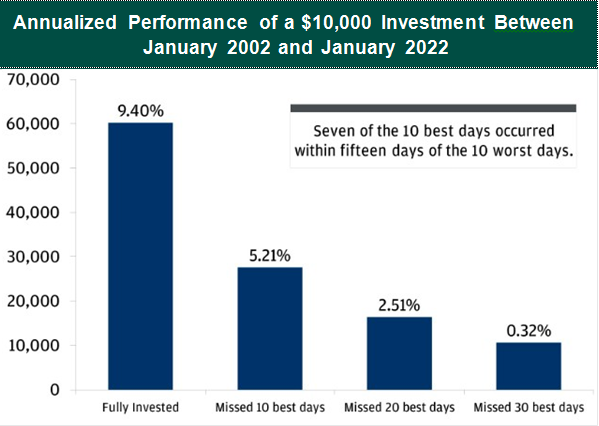
Source: FactSet
Therefore, the next time market volatility feels scary enough to make you second guess your long-term investment strategy, think hard before you get out of the market. Statistics show there is a 70% chance you could miss one of the best days if you abandon your investment within two weeks of the 10 worst days. Let the team at Greystone take the emotion out of investing for you.
Where Do We Go From Here?
Even though this year has been one of the worst starts in stock market history, there are some reasons for optimism going into the second half. Although inflation should remain at elevated levels for some time, we believe it is likely that it has reached the peak and we should start to see it moderate going forward as aggregate demand cools down and supply chain bottlenecks ease.
The Fed has been walking on a tightrope, trying to rein in high inflation without triggering a recession, which is looking increasingly unlikely. We could debate on whether or not the Fed waited too long to start implementing the rate hikes, but at least we are now starting to see some signs of the tighter monetary policy working toward the objective of hampering inflation.
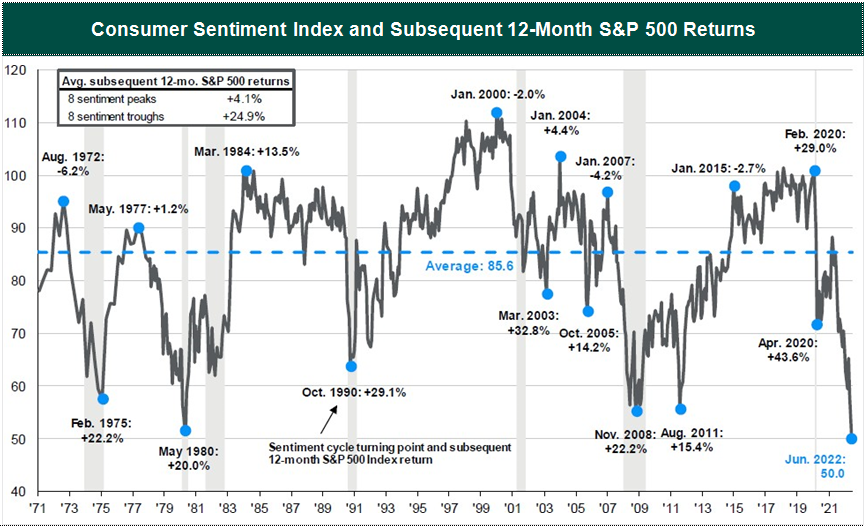
The juxtaposition of pent-up demand for goods and services and excess demand for labor with a clear softening in retail sales and low consumer confidence makes it very challenging to conclude if we are on the brink of a recession. In fact, consumer confidence is at an all-time low based on the Consumer Sentiment Index conducted by the University of Michigan.
Source: FactSet, Standard & Poor’s, University of Michigan, JPMorgan Asset Management
On a positive note, we can use consumer confidence as a contrarian indicator. Typically, when things start to turn sour, consumers exaggerate and become overly pessimistic. That causes the stock market to decline more than is justified, which in turn creates the preconditions for the market to produce above-average subsequent performance. Therefore, it’s not really surprising to see that the average 12-month return from the 8 sentiment troughs over the last 50 years shown above is 24.9%.
But what if the U.S. does enter a recession? As GDP growth estimates keep getting revised lower for the second quarter, it is possible that we could in fact already be in a recession. The strengthening of the U.S. dollar has been the main factor contributing negatively to GDP growth, which serves as a primary determinant of a recession. Higher domestic interest rates and a relatively more robust economy compared to the rest of the world has played a substantial role in widening the trade deficit, making imports cheaper and exports more expensive.
Time will tell though if we are indeed in a recession as the National Bureau of Economic Research (NBER) is generally recognized as the authority that defines the starting and ending dates of U.S. recessions. NBER’s definition of what constitutes a recession is “a significant decline in economic activity spread across the economy, lasting more than a few months, normally visible in real GDP, real income, employment, industrial production, and wholesale-retail sales.”
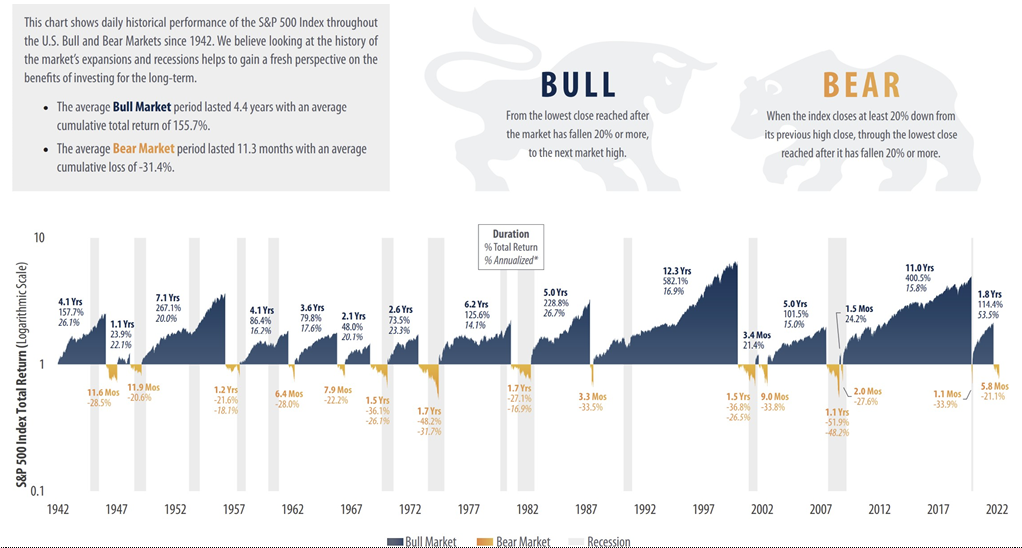
One thing we know for certain is that we are currently in a bear market, as the market declined more than 20% in June from its January high. So how long can we expect to stay in a bear market and how much more can we expect the market to decline? Obviously, nobody knows for sure, but we can look at historical data to get an idea of what we can expect.
Since 1942, the average bear market has lasted just over 11 months. With the current bear market heading into its seventh month, there could be light at the end of the tunnel sooner rather than later. Economic downturns are a natural part of the business cycle, but over time innovation and productivity gains tend to lead to higher corporate earnings and market returns. And when we do eventually come out of this slump, there will be another bull market, which history shows there is a very good possibility that it will be longer and stronger compared to the downturn that preceded it. Since 1942, the average bull market has lasted over four times longer than the average bear market.
Source: First Trust Portfolios L.P.
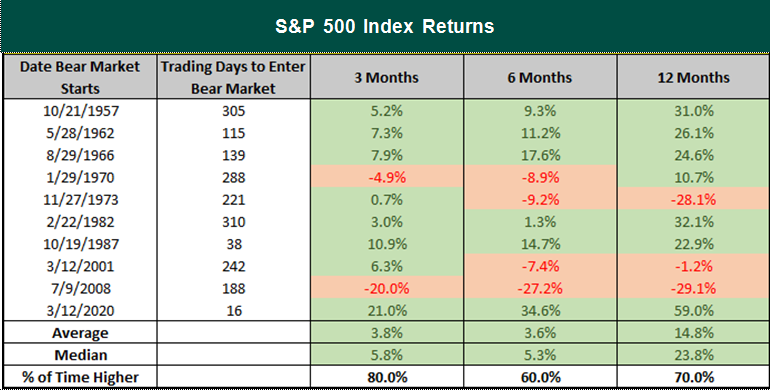
Also working in our favor is that on average, stocks actually do pretty well once they enter a bear market. There are no guarantees, as every bear market is different, but the good news is that since 1950, in the 12 months following the S&P 500 moving into a bear market, which occurred in June, stocks returned an average of nearly 15%, with a median gain of almost 24%.
Source: LPL Financial
We present this data not to say the market will right itself all of the sudden and everything will be terrific next week, or next month, but rather to keep things in perspective with all of the negativity that investors can’t help reading about or hearing in the media. There are definitely headwinds out there that we will continue to face, which is why the Greystone investment team expects the volatility to persist, especially as the Fed continues to tighten monetary policies. This course of action is necessary though, as the most important thing we need to see is inflation getting under control and begin a path back to normalization.
The market has been pricing in a recession over the last few months, and we believe stocks are currently oversold and investors are too pessimistic. Even if a recession does occur, or if it turns out that we are already in one, there is no reason to expect that it will be nearly as severe as some of the more recent occurrences. The economy is in a lot better place to handle a recession, and we think a shallow recession is the most likely outcome, with a duration shorter than historical averages.
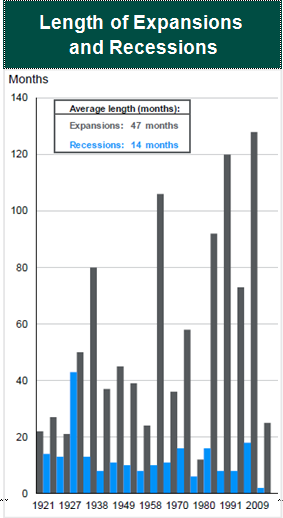
The economy spends the majority of the time in expansion as shown in the chart to the right. Therefore, it is ultimately more important for investors to be well-positioned for expansions than to try to time getting in and out of the market during recessions or bear markets as we are currently dealing with. Let Greystone do the work for you. We align our portfolios to get more defensive during uncertain times and aggressive when our research indicates favorable market conditions.
Source: BEA, NBER, JPMorgan Asset Management
PLEASE SPEAK WITH YOUR WEALTH ADVISOR IF YOU HAVE ANY QUESTIONS OR WANT TO REVIEW YOUR PORTFOLIO TO BE SURE THAT YOU ARE IN THE MOST APPROPRIATE STRATEGY TO HELP YOU ACCOMPLISH YOUR LONG-TERM GOALS.

SINCERELY,
THE INVESTMENT TEAM AT GREYSTONE FINANCIAL GROUP
DISCLOSURES
There is no guarantee investment strategies will be successful. Investing involves risks including possible loss of principal. There is always the risk that an investor may lose money. A long-term investment approach cannot guarantee a profit.
All expressions of opinion are subject to change. This article is distributed for educational purposes, and it is not to be construed as an offer, solicitation, recommendation, or endorsement of any particular security, products, or services. Investors should talk to their Wealth Advisor prior to making any investment decision.

