WE ARE BEYOND THE HALFWAY MARK OF THE YEAR, and thus far, the stock market has given investors ample reasons to rejoice. The major equity indexes have each notched all-time highs during July and the backdrop for stocks remains favorable, at least in the near term. Slowing but not stalling economic growth, a cooling but not collapsing labor market, and moderating inflation provide a constructive landscape for markets as we approach what is seasonally a more volatile time of year.
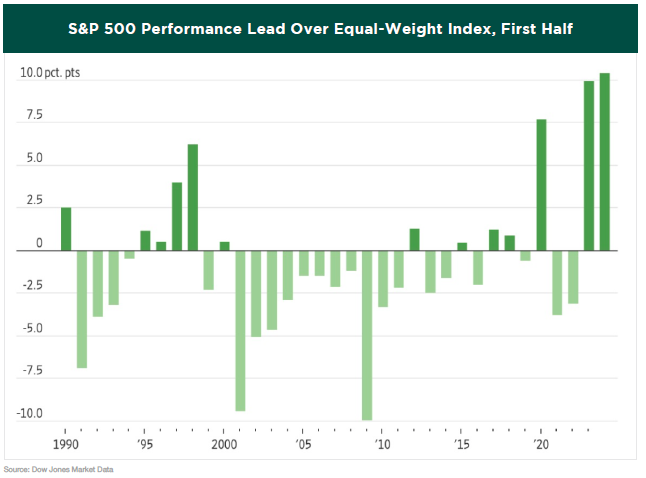
The stock market at the index level is having a historic start to the year. As of this writing, the S&P 500 has made 38 all-time highs, which is on pace for the second-most all-time highs in a calendar year, trailing only 1995. On the surface, it has moved higher with little incident and subdued volatility. However, dissecting the index at the individual constituent level tells a different story with correlations among individual stocks dropping to record low levels. This is evident by comparing the return differential between the equal-weighted index and market cap-weighted index for the S&P 500 through the first half of the year. As of June 30, the equal-weighted index was up just 4%, underperforming the S&P 500 by 11%. This is the biggest gap in the first half of a year going back to 1990.
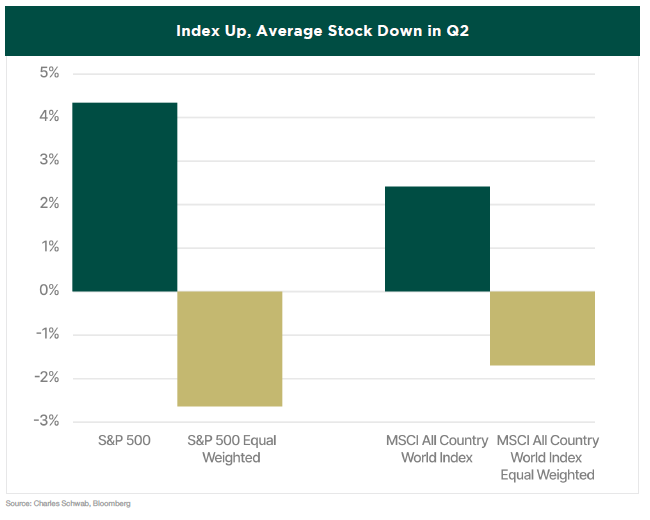
In the second quarter alone, the cap-weighted index was up 4.3% while the average stock in the S&P 500, measured by the equal-weighted index was down -2.6%. This was also true around the world with the MSCI ACWI Index (All Country World Index) up 2.4% while the average stock in the global benchmark was down -1.7% in the quarter. This occurrence is very rare, having only happened five times in the past 30 years. The divergence was driven by market enthusiasm for all things Artificial Intelligence (AI), which propelled a select set of mega-cap tech stocks higher, whose outsized impact on market returns intensified in the second quarter.
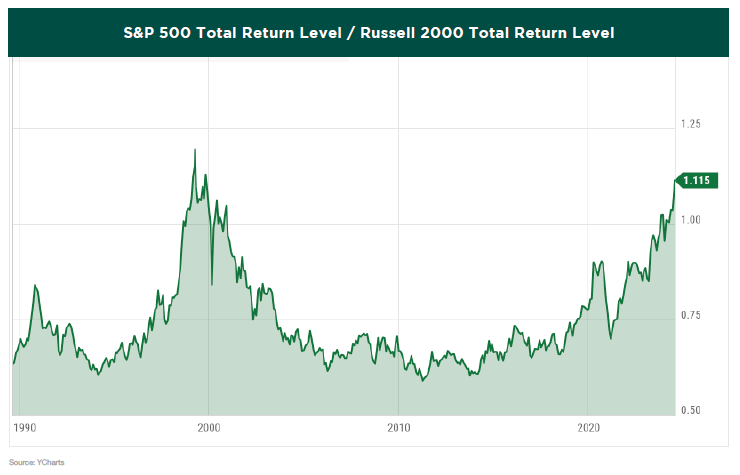
While the divergence this year between the equal-weighted and cap-weighted indexes is significant, the gap between large-cap stocks and small-cap stocks is even more shocking. Smaller companies struggle in a high interest rate environment as it is difficult for them to raise capital, and with the biggest companies thriving, investors are choosing to avoid the additional risk. In the first half of 2024, the Russell 2000 index, which consists of 2,000 small-cap stocks, lagged the S&P 500 index of the 500 largest stocks by approximately 13.5%. This divergence caused the ratio of large-cap to small-cap returns to rise to its highest level since October 1999.
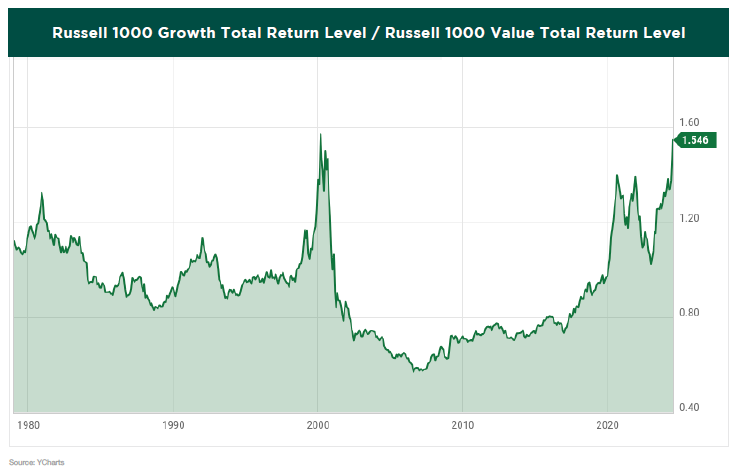
The biggest of these large-cap stocks are considered growth companies. Consequently, the outperformance of growth stocks over value stocks widened to its highest level since March 2000. Yes, that March 2000 – the peak of the dot-com bubble.
There will eventually be a reversion to the mean, but the question remains: when will this occur? While nobody knows the answer, some investors believe we may be witnessing the early stages of a rotation from large-cap growth stocks to small- and mid-cap stocks. The previous charts were as of July 10, and the very next day we witnessed a dramatic shift in market behavior. The Russell 2000 surged higher with a gain of 3.6% while the S&P 500 f ell -0.9%. This marked the second-largest single-day outperformance by small caps on record, surpassed only by the differential in October 2008. This rotation persisted for the following three days, resulting in the largest short-term small-cap outperformance in history.
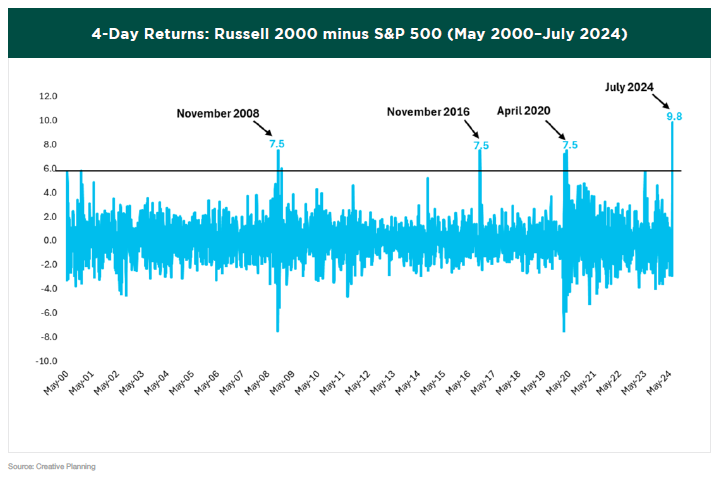
Time will reveal whether this rotation is genuine or just a fleeting trend. However, some degree of rotation and broadening should benefit the market, and investors with diversified portfolios will likely welcome a shift from the narrow focus we’ve experienced lately.
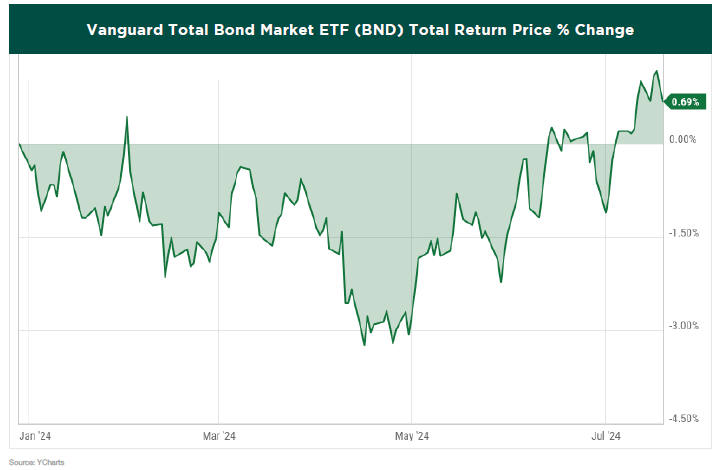
While the stock market has been booming for most of the year, the bond market has been languishing in the red. That changed earlier this month with the better-than-expected inflation report and the subsequent decline in interest rates. The Vanguard Total Bond Market ETF has now turned positive for the year.
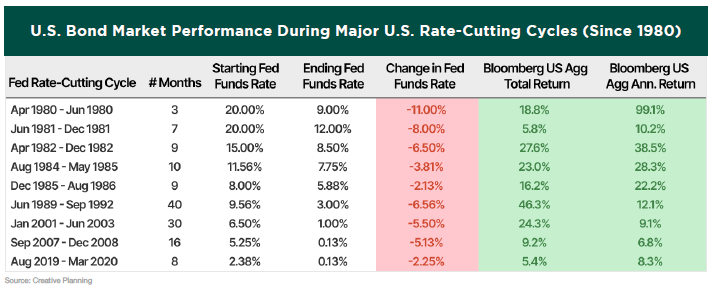
Although fixed income has experienced a historically challenging period over the past few years, the outlook for bonds appears brighter going forward. During the last nine rate-cutting cycles, bonds have typically received a boost, with the Bloomberg US Aggregate index showing above-average annualized returns. We anticipate the Fed will make the first rate cut in September.
While inflation and the possibility of rate cuts have been the main focus for investors since the last rate hike a year ago, the upcoming election and its potential market impact depending on the winning party have now taken center stage. In the past month, the chances of another Trump presidency seemed to increase following President Biden’s disastrous debate performance on June 27, which led to doubts within his own party about his mental fitness. Additionally, Trump’s poll numbers got a boost after a shocking assassination attempt on his life on July 13. Consequently, investors started betting on stocks that could benefit if Trump regains the White House, amid growing speculation that Biden would withdraw from the race.
On July 21, that speculation became reality as Biden announced he was ending his reelection bid and endorsed Vice President Harris as the Democratic nominee. The shakeup at the top of the ticket comes just weeks before Democrats are set to convene for the Democratic National Convention. There still remains uncertainty within the Democratic Party, with the possibility of an open convention looming. In such a scenario, candidates vying for the nomination would work to convince delegates — who will select the nominee at the convention — to vote for them.
A candidate needs to secure 1,968 delegates, a majority of pledged delegates, in the first round of voting to clinch the Democratic nomination. Democrats have two types of delegates: pledged, who must support the candidate chosen by voters in their state primaries and caucuses; and superdelegates, party leaders who are not committed to any candidate and cannot vote on the first ballot at the convention. President Biden was heading into the convention with nearly 3,900 pledged delegates, but now they can vote for the candidate of their choosing and do not have to support Harris. However, as of this writing, it looks very likely that Vice President Harris will ultimately become the Democratic candidate who will face off against former President Trump in the November election.
With Biden dropping out, Trump’s path to victory might not be as clear as it recently seemed. While the stock market doesn’t necessarily favor one party over the other, it does dislike uncertainty. Therefore, market volatility is expected to increase leading up to the election, as it typically does in election years, and we believe it is too soon for investors to align their portfolios based on which party they think will win the election.
No matter which party wins, the policy changes and their impact are far from clear. One might argue that the composition of Congress is even more significant in terms of policy changes. Historically, a divided Congress is best for the stock market as it creates gridlock. Mixed control of the House and the Senate means more roadblocks to either party’s agenda, leading to slower or no change at all. Since the markets fear uncertainty, maintaining the status quo is typically welcome news.
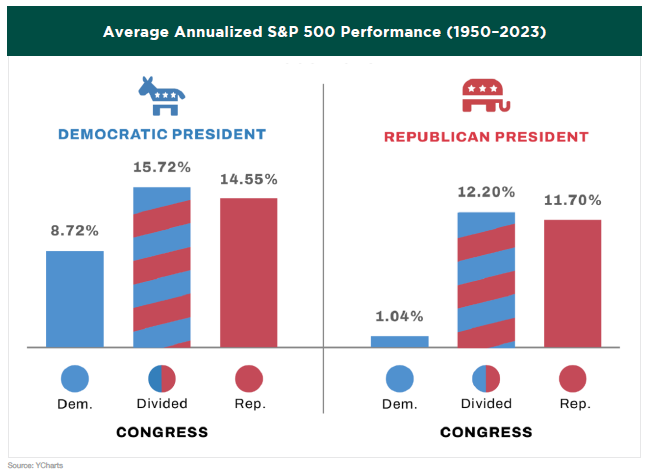
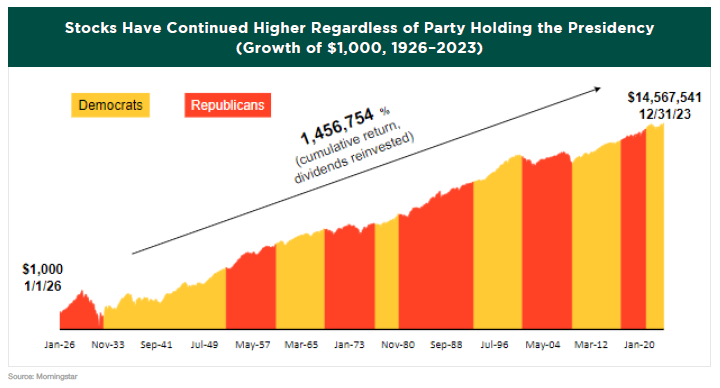
Although popular myths suggest that one party or the other is “better” for market returns, historical data does not support these theories. Regardless of the government’s composition after the election, there is a good chance that the stock market, which is nonpartisan, will be just fine.
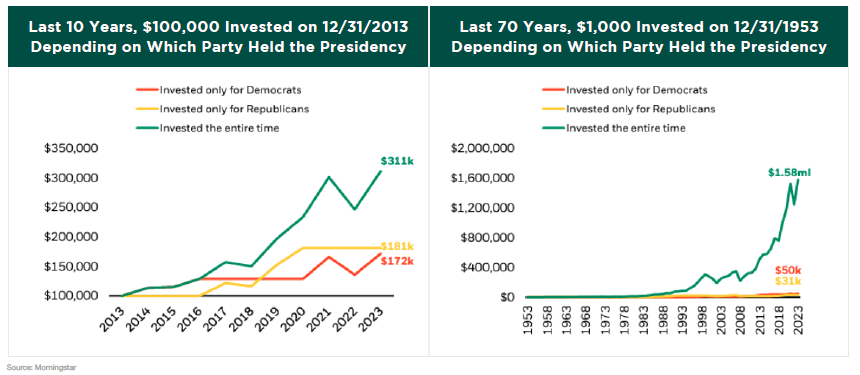
For investors, it’s time in the market that matters, not the president’s political party. We believe making drastic changes to your asset allocation based on which party holds office would be a mistake. As the following chart shows, if someone had decided to invest only during a certain party’s presidency, they would have significantly harmed their portfolio.
A bit of historical perspective is always beneficial when considering financial markets. Over the long term, U.S. stocks have generally performed well, regardless of the administration in power. Importantly, markets have continued to trend positively over time. The power of compounding returns means that for the long-term investor, focusing on managing volatility and simply remaining invested may prove more powerful than reacting to a given administration.
Regardless of political affiliation, this election cycle is likely to evoke strong emotions among investors. It can be tempting to put money where your convictions are, whether you feel optimistic or pessimistic about the election outcome. However, historically, financial markets have largely been unbothered by both presidential and midterm elections. Attempting to modify an investment strategy to benefit from an expected post-election market shift could ultimately end up backfiring.
While elections may introduce some short-term uncertainty, prioritizing long-term investing goals should remain paramount in investment decision-making. In our view, rising corporate profits, ongoing economic expansion, and the potential for lower yields later in the year provide a favorable backdrop for the markets. We anticipate that this environment will be supportive of both stocks and bonds.
Rather than trying to predict near-term political cycles, most investors would benefit more from adopting a thoughtful long-term financial plan tailored to their specific needs and adhering to it. At Greystone, we believe such a plan should be based on an investor’s goals, risk tolerance, and other individual considerations. We don’t believe market history supports factoring in election cycles when managing long-term investments.
PLEASE SPEAK WITH YOUR WEALTH ADVISOR IF YOU HAVE ANY QUESTIONS OR WANT TO REVIEW YOUR PORTFOLIO TO BE SURE THAT YOU ARE IN THE MOST APPROPRIATE STRATEGY TO HELP YOU ACCOMPLISH YOUR LONG-TERM GOALS.

SINCERELY,
THE INVESTMENT TEAM AT
GREYSTONE FINANCIAL GROUP
DISCLOSURES
There is no guarantee investment strategies will be successful. Investing involves risks including possible loss of principal. There is always the risk that an investor may lose money. A long-term investment approach cannot guarantee a profit.
All expressions of opinion are subject to change. This article is distributed for educational purposes, and it is not to be construed as an offer, solicitation, recommendation, or endorsement of any particular security, products, or services. Investors should talk to their Wealth Advisor prior to making any investment decision.

