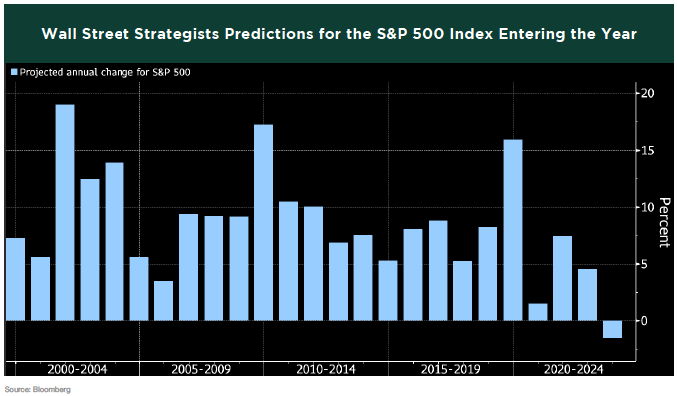
ONE OF WALL STREET’S ADAGES — the market does what it needs to do to prove the majority wrong — came true in the first half. Coming into the year, many sentiment polls were indicating the second-longest streak of extreme pessimism on record, after 2008-09. In fact, for the first time in decades, strategists were actually predicting a down year for stocks in 2023, a rarity on the perennially bullish Wall Street.
In spite of, or perhaps because of the pessimism, the market staged one of its best first halves on record. The S&P 500 jumped 15.9%, the best since 2019, second best this century, and 12th-best since 1926. The tech-heavy Nasdaq Composite soared 31.7%, its strongest start since 1983 and third best since data began in 1972. And since the market has increased at least 20% off its lows from back in October, we are now technically in a new bull market.
With these facts, it would be reasonable for someone to believe that the broad stock market was exhibiting healthy behavior the first half of the year. However, the truth of the matter is that at least for most of the first five months, it was doing just the opposite. The reason for this is because the vast majority of market participants weren’t actually contributing to the positive index returns. Instead, it was basically only the contributions from a select group of stocks
that were responsible for the positive index performance up until the start of June. Let’s dig a little deeper into the stock market disparity we saw in the first half of the year.
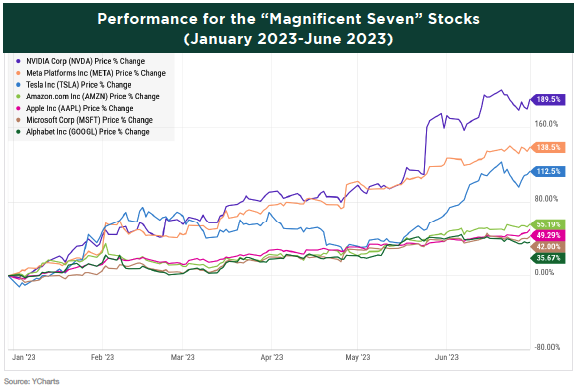
If you’ve read any publications or watched television programs pertaining to the stock market lately, there’s a good chance you’ve seen or heard the term “Magnificent Seven” being mentioned. This refers to the seven stocks that are largely responsible for the positive performance so far this year in the Nasdaq and S&P 500 indices. That is because all of these stocks have all appreciated significantly this year, and because they are the seven largest U.S. companies by market-cap, they are also the top weighted positions within each index.
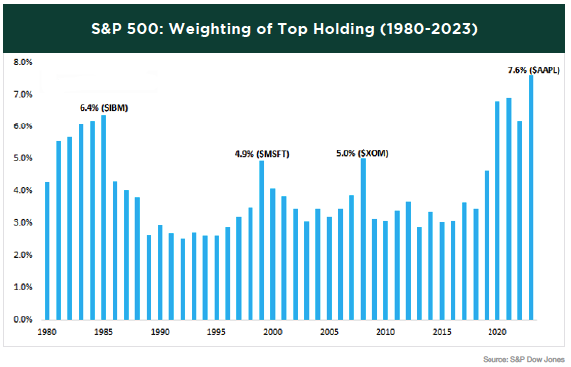
The strong performance of that group, coupled with the minimal to negative performance of a significant portion of other market participants, has resulted in an unprecedented level of market concentration for those top stocks. In the S&P 500, those seven stocks make up almost 27% of the entire index. The combination of Apple and Microsoft alone make up 15%. Furthermore, Apple’s 7.6% weighting is the largest ever for a single stock with data going back to 1980.
This concentration only gets more excessive when we look at the Nasdaq-100 Index. These seven stocks carry a combined weight of over 50% of the index, with Apple and Microsoft together accounting for 25%. In fact, the concentration has become so extreme it is causing the index provider to take action. At the end of July, the combined weight of the top six holdings will be cut to 40%, with the reduction redistributed to the other index constituents.

Even in the more diversified All Country World Index (ACWI), which has over 2,300 constituents, the “Magnificent Seven” accounts for a record concentration of 16%.
The reason we previously mentioned that this is unhealthy market behavior is because while the performance was great for the top group of mega-cap growth stocks, for the most part the rest of the market wasn’t participating, at least for a good portion of this year. Because of this, most sensible investors with diversified portfolios weren’t able to keep up with the returns from a broad market index such as the S&P 500.
When we compare the S&P 500, which is market- cap weighted, to the Equal Weight S&P 500, which assigns the same weighting between all constituents, we can see the magnitude of the disproportion of returns. Through June 6, the S&P 500’s outperformance over its equally weighted counterpart was the largest on record based on data starting in 1990.
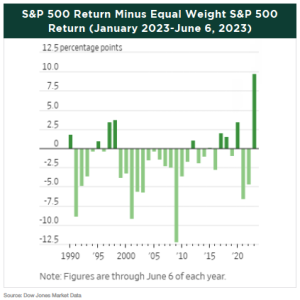
As shown in the following chart, the divergence actually started when the mini banking crisis occurred in March, in which we saw the second, third, and fourth largest bank failures in history. In a flight to safety, huge inflows of investor money went into stocks such as the “Magnificent Seven,” whose balance sheets were the biggest, with low debt and strong free cash flow. Investors were betting that these stable growth stocks would have the ability to maintain and increase revenues and earnings even in a weakening economy.
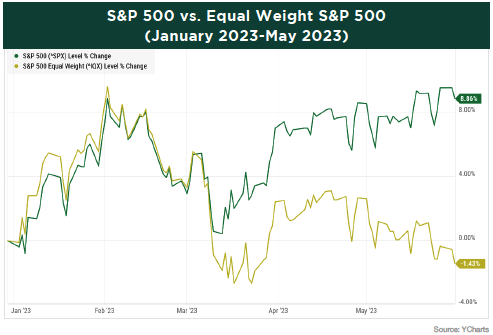
Interestingly, if the “Magnificent Seven” returns were excluded from the S&P 500 for the first five months, the index’s performance would have actually been negative. That doesn’t sound like a thriving stock market.
Whereas the tech-heavy Nasdaq is more growth-oriented in nature, the popular Dow Jones Industrial Average is skewed toward value stocks and holds more defensive positions. And while the Nasdaq returned over 30% in the first half of the year, the Dow squeaked out a mere 3.8%, and was actually negative through May.
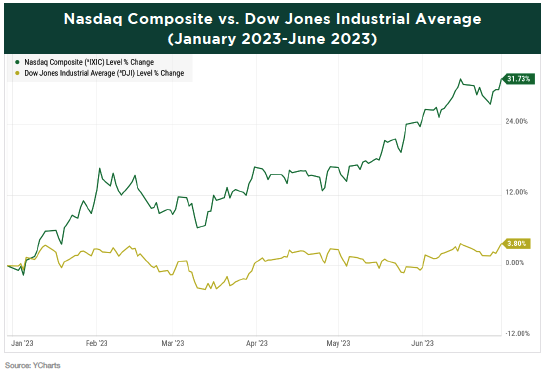
Based on the disparity of these two index returns, its not surprising that growth stocks are outperforming value stocks this year, but the extent to which we are witnessing this is at historic levels. The spread between the Russell 1000 Growth and Russell 1000 Value is the second-largest (after 2020) since data began in 1979.

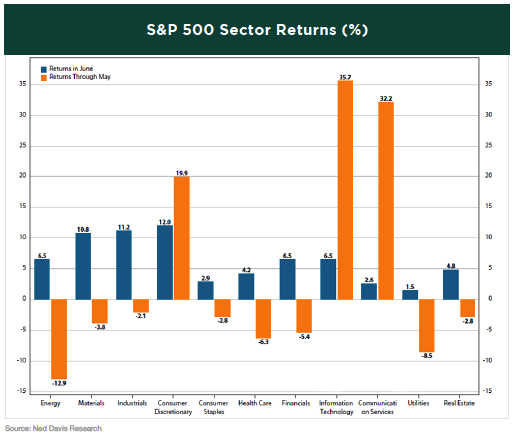
Therefore, its also not surprising to see that growth sectors such as Technology, Communication Services, and Consumer Discretionary are vastly outperforming the sectors that are more defensive in nature this year. In fact, through May, the three aforementioned sectors were the only sectors that were positive for the year. Since growth has been in favor lately, and since many growth companies don’t pay a dividend, its not unexpected that dividend payers would be lagging non- payers. But the extent of the performance gap is pretty shocking. Dividend payers had their worst first half vs non-payers since 2009 and fourth worst since 1973.
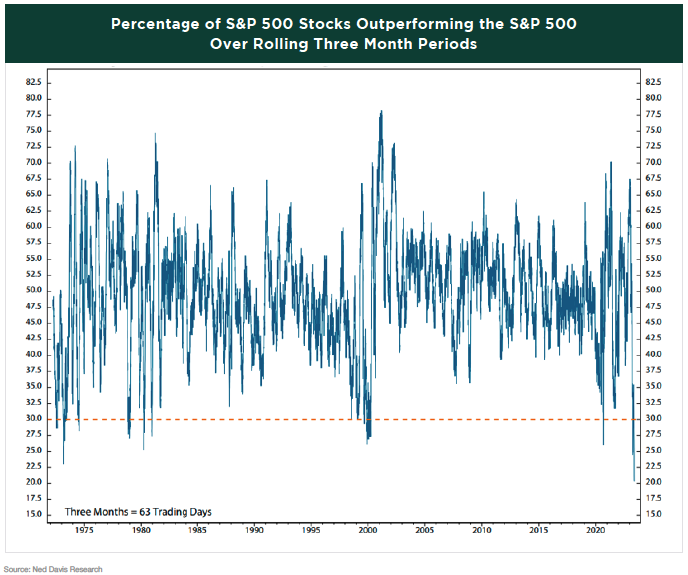
To further demonstrate just how particularly narrow this recent market rally has been, we can take a look at the percentage of S&P 500 stocks that were outperforming the index on a rolling three-month basis as of the end of May. The reading of 20.3% is a record low, dating back to 1972.
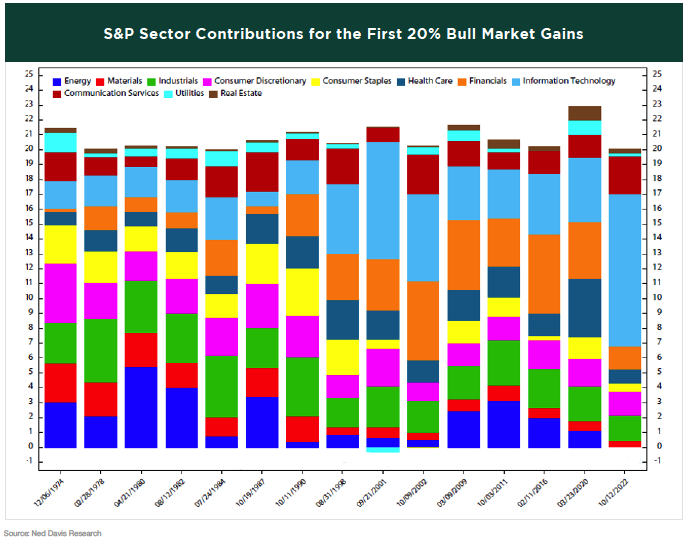
Shifting back to sectors, the start of this bull market has been unlike any other. Of the initial 20% rise off the October low for the S&P 500, the three growth sectors previously mentioned accounted for 14.5% of that. The Technology sector was responsible for 10.3% of the initial 20% gain alone, the highest contribution for any single sector on record. On the other hand, contributions from the more value-leaning sectors of Energy, Materials, Industrials, and Health Care were the lowest on record.
All of this information just goes to show that while yes, there were certainly select pockets of the market that performed well, the broad market as a whole wasn’t acting nearly as well as some indexes made it seem. And being diversified money managers, we at Greystone knew it was going to be hard to keep pace with the market as long as the rally remained so narrow. For risk management purposes, it is unlikely that we will ever hold a 7% or 8% position in a single stock, let alone have a handful of stocks comprising 40-50% of our clients’ portfolios. We also didn’t think that this rally was sustainable without broader market participation. The good news is that is exactly what we started to see take shape in June.
With the debt ceiling resolved, a Fed pause in rate hikes expected, and continued stability in regional banks, the rally in stocks started broadening out. Not only did we get more participation from other sectors, but all eleven sectors had positive returns in June as the following chart displays. These positive developments came alongside declining inflation, as the Consumer Price Index (CPI) hit the lowest level in two years. And for the most part, economic data has remained resilient, which has reduced fears of a near-term recession.
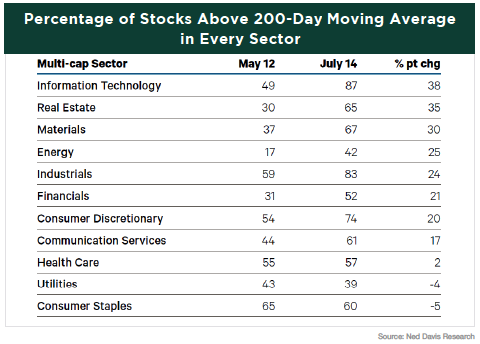
This improvement has carried into July for the most part too. While large-cap stocks and growth sectors have been and still are leading the way, we are seeing some encouraging signs within the small and mid-cap space as well as improved breadth across almost every sector. Seeing an increase in the number of stocks trading above their moving averages is one way to identify improving market breadth. We can see from the following chart that this is exactly what has been occurring over the last couple of months in most sectors.
IN CONCLUSION
As we continue to move along in the second half of the year, the market outlook is arguably the most positive it’s been since late 2021. The resiliency of the market this year has been truly impressive. While clearly the first half, and particularly the second quarter brought positive developments in the economy and the markets, leading a growing number of investors to become more bullish in the near-term, it’s important to remember that potentially significant risks remain to the economy and markets.
The market has taken a decidedly positive view on the ultimate resolution of multiple macroeconomic unknowns, but their outcomes remain uncertain and thanks to the strong year to date rally in equities, there may not be much room for disappointment.
Firstly, the economy has not yet felt the full impact of the Fed’s historically aggressive tightening campaign. While the economy has shown remarkable resilience thus far, history tells us that the effects of rate hikes can take far longer than most expect to impact economic growth. It’s premature to think the economy is “in the clear” from recession risks, and we should be prepared for a possible slowdown as we move through the end of this year and into next. The key for markets will be the intensity of that slowing, because at these valuation levels, stocks are not pricing in a significant economic slowdown.
Regarding inflation, clearly there has been progress in bringing it down. But there is still work to be done on that front, and as we have written about in previous quarters, getting the inflation rate down to the Fed’s target of 2% is going to get tougher from here on out. If inflation bounces back, or fails to continue to decline, then the Fed could easily hike rates higher which would weigh further on economic growth.
Turning to banks, markets have taken the regional bank failures in stride, as the mini crisis caused minimal volatility in the second quarter. We believe it’s premature to consider the crisis “over” and at a minimum, reduced lending by regional banks poses an additional threat to the commercial real estate market and small businesses more broadly.
Finally, markets are trading at their highest valuation in over a year, and investor sentiment has become increasingly optimistic. The Bullish/Bearish Sentiment Index hit the most bullish level since November 2021, right before the market collapse started in early 2022. Positive sentiment doesn’t mean markets will decline, but the sudden burst of enthusiasm needs to be considered in the context of what is still an uncertain macroeconomic environment and markets no longer have the protection of low expectations and valuation to cushion potential declines.
While we are certainly pleased with the market’s performance this year and have turned more bullish on the near-term outlook over the past couple of months, we would encourage investors to be optimistic, but also remain cautious. It’s easy to look at the market returns and wonder why your portfolio hasn’t returned 35% like the Nasdaq has so far this year. Our goal is to provide you with a diversified portfolio that manages the market risk based on your personal goals and risk tolerance. Sometimes, a well-diversified portfolio will lag the market when it is up, however, our goal is to minimize the downside when the market falls. Sticking to an asset allocation is part of a long-term investment philosophy that prevents making impulsive investment decisions driven by short-term market fluctuations. It is our job as your investment advisor to keep you focused on your long-term goals and help you achieve them.
PLEASE SPEAK WITH YOUR WEALTH ADVISOR IF YOU HAVE ANY QUESTIONS OR WANT TO REVIEW YOUR PORTFOLIO TO BE SURE THAT YOU ARE IN THE MOST APPROPRIATE STRATEGY TO HELP YOU ACCOMPLISH YOUR LONG-TERM GOALS.

SINCERELY,
THE INVESTMENT TEAM AT GREYSTONE FINANCIAL GROUP
DISCLOSURES
There is no guarantee investment strategies will be successful. Investing involves risks including possible loss of principal. There is always the risk that an investor may lose money. A long-term investment approach cannot guarantee a profit.
All expressions of opinion are subject to change. This article is distributed for educational purposes, and it is not to be construed as an offer, solicitation, recommendation, or endorsement of any particular security, products, or services. Investors should talk to their Wealth Advisor prior to making any investment decision.

