IN THE PREVIOUS QUARTERLY recap sent out in April, we mentioned the potential long-term benefits of staying invested, no matter how dire things look in the world around us. On March 23, 2020, we witnessed the S&P 500 and Dow Jones Industrial Average drop 34% and 37%, respectively, from their previous highs on February 19th, just a month prior. Since that market bottom in March 2020, the resiliency demonstrated by the market itself has been nothing short of spectacular. It took the Dow Jones Industrial Average just eight months to recover and surpass its previous February all-time high and the S&P 500 an even shorter amount of time as it marked a new all-time high in less than six months. Since then, we have seen the major indexes consistently post new all-time highs month after month.
Looking back on that scary time in early 2020, when fears and uncertainties plagued the market, it would have been tempting to cash out and sit on the sidelines for a while. While no one has a crystal ball, responding emotionally to short-term events can be a mistake. Since the market bottom through July 11, 2021 (the time of this writing) the Dow Jones Industrial Average has climbed over 85%, the S&P 500 over 90%, and the Nasdaq Composite over 110%. Those are truly remarkable figures, and one would be disappointed not to have taken advantage of it.
Losses hurt more than gains feel good. Market lows can result in emotional decision making. Taking “control” by selling out of the market after the worst days is likely to result in missing the best days that follow. As displayed in the chart below, the impact of being out of the market during the best days can significantly impact your portfolio’s performance over time.
Returns of the S&P 500
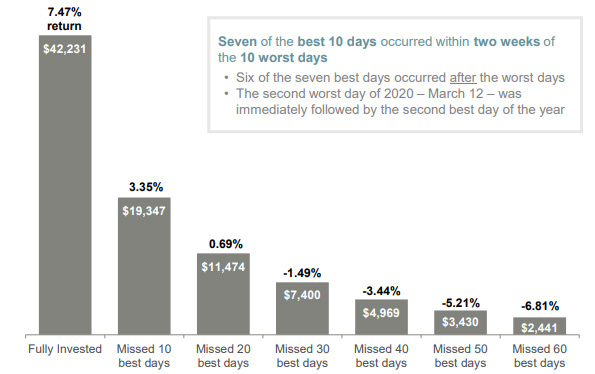
LEFT:
Hypothetical performance of a $10,000 investment between January 2, 2001 and December 31, 2020
Source: J.P. Morgan Asset Management analysis using data from Bloomberg. Returns are based on the S&P 500 Total Return Index, an unmanaged, capitalization-weighted index that measures the performance of 500 large capitalization domestic stocks representing all major industries. Indices do not include fees or operating expenses and are not available for actual investment. The hypothetical performance calculations are shown for illustrative purposes only and are not meant to be representative of actual results while investing over the time periods shown. The hypothetical performance calculations shown are gross of fees. If fees were included, returns would be lower. Hypothetical performance returns reflect the reinvestment of all dividends. The hypothetical results have certain inherent limitations. Unlike an actual performance record, they do not reflect actual trading, liquidity constraints, fees and other costs. Also, since the trades have no actually been executed, the results may have under- or overcompensated for the impact of certain market factors such as lack of liquidity. Simulated trading programs in general are also subject to the fact that they are designed with the benefit of hindsight. Returns will fluctuate and an investment upon redemption may be worth more or less than its original value. Past performance is not indicative of future returns. An individual cannot invest directly in an index. Data as of December 31, 2020.
As the title in this quarter’s piece suggests, sailing in times of calm seas does not necessarily make you a good sailor. The real test comes when you are faced with troubled waters. The same can be said about money managers during times such as these when the market has been relatively easy to navigate as the economy continues to recover. But when the next unpredictable setback, or to stick with the sailing metaphor, the next rogue wave occurs, the Greystone Investment Team looks forward to the challenge of minimizing the damage and righting the ship quickly to give our portfolios the best chance to thrive.
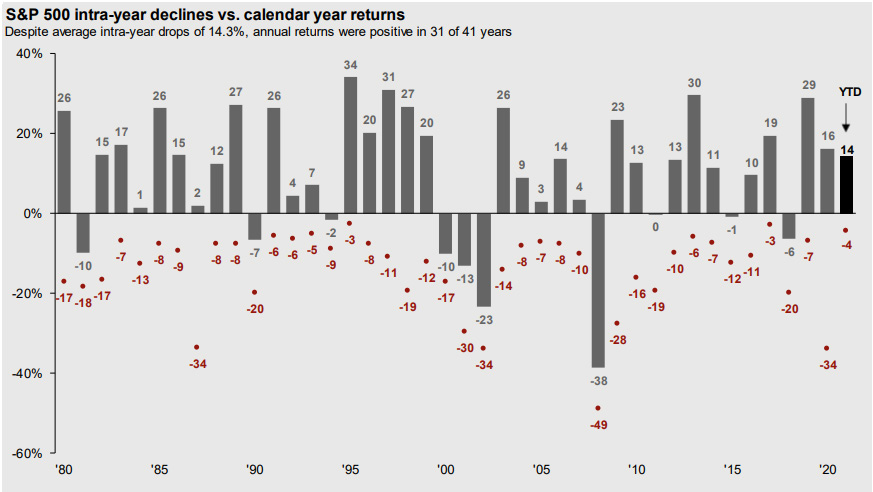
It would not be a surprise if, in the near future, something happens that impedes the momentum the market has carried through the year so far. Based on historical information, we should expect to see a bigger intra-year decline than we observed in the first half of 2021, which was only 4%. Since 1980, the average intra-year decline for the S&P 500 is 14.3%. The biggest intra-year decline in the past 40 years has been less than 4% on only two occasions. Therefore, there is a very good chance the market will experience a pullback (decline between -5% and -9.99%) and possibly even a correction (decline over -10%). But as we stated above, it is easy to lose sight of the potential long-term benefits of staying invested when faced with short-term events. Typically, the market’s best performing days follow shortly after the worst days, and it would be unfortunate to miss out on them. The chart below shows the annual returns and intra-year declines since 1980.
S&P 500 intra-year declines vs. calendar year returns
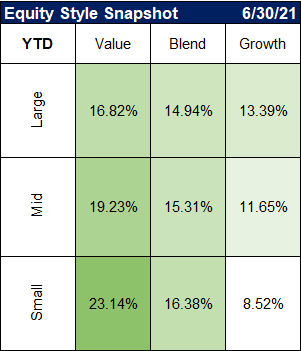
Looking back at the market performance for the first half of 2021, some of the main takeaways are that value outpaced growth and small-caps bested mid and large-caps. Growth stocks had a very strong June which narrowed the gap considerably, but value remained on top through the first half of the year. We at Greystone expect these results to continue in the second half of the year with value outperforming growth and small-cap stocks leading the way over mid and large-cap stocks.
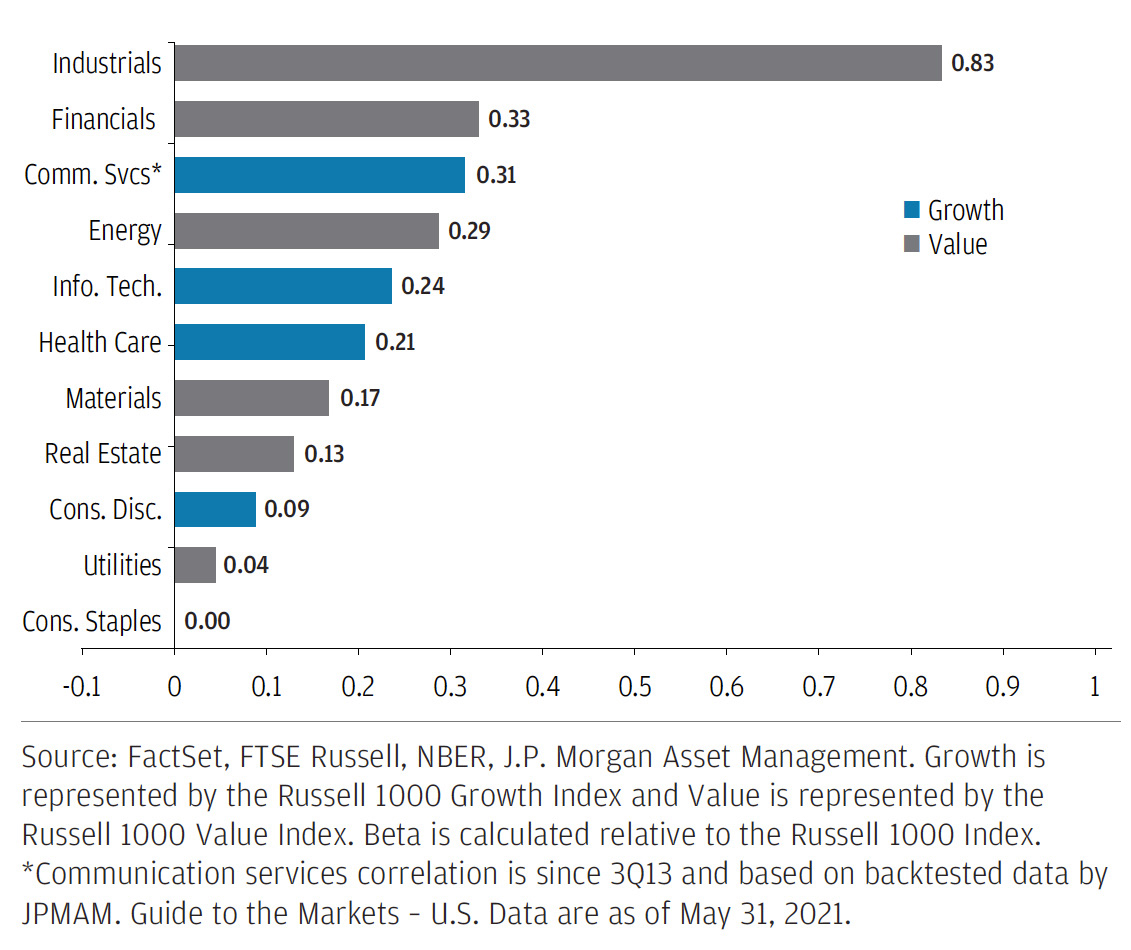
One reason we anticipate value stocks to remain strong is that we expect interest rates to rise further, reflecting robust economic activity both in the U.S. and abroad. Generally speaking, value tends to outperform growth during periods of above-trend economic activity and rising interest rates. Part of this has to do with the fact that the earnings of valueoriented sectors tend to be more sensitive to the pace of economic growth.
S&P 500 sector earnings correlation to real GDP, 1Q09–4Q20
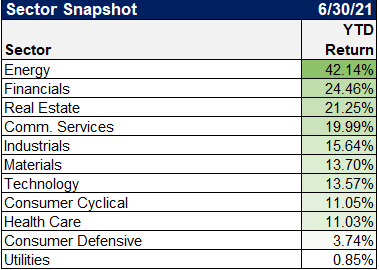
SECTOR SNAPSHOT
All 11 sectors ended in positive territory in the first half with Energy running away with the top spot at over 42%, Financials coming in a distant second at 24.5%, and bringing up the rear was Utilities gaining just under 1%.
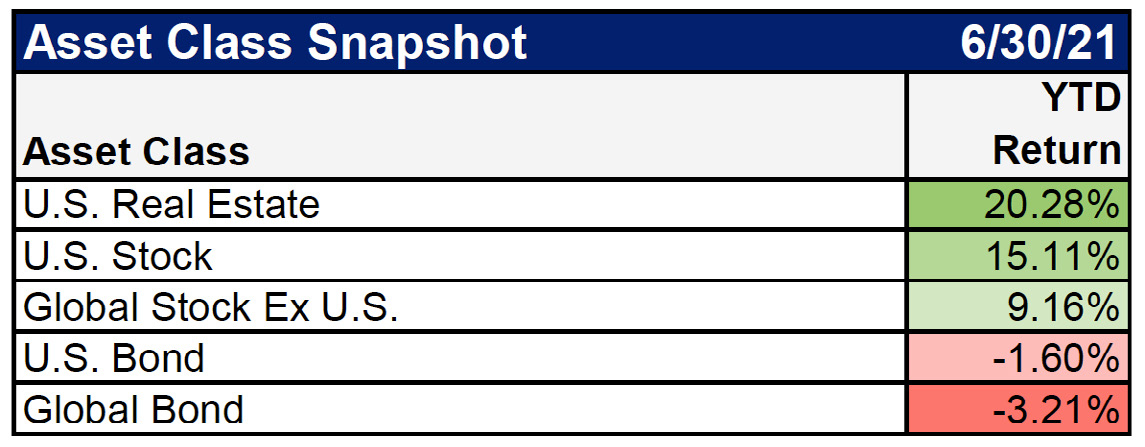
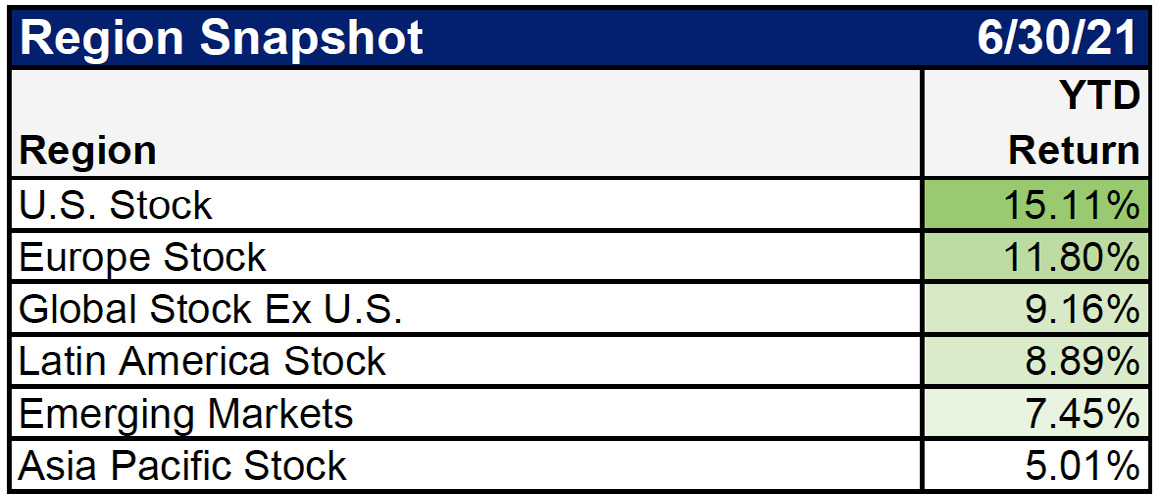
When looking at asset classes, U.S. Real Estate had a great first half, outpacing both domestic and international stocks. Bonds have had a tough year so far and finished the first half in negative territory. Comparing the global equity markets, U.S. Stocks set the pace, returning over 15%, leading European Stocks which was next best at 11.8%.
As we look forward to the second half of the year, there are a few specific things that we are keeping an eye on. The first is the progress of the COVID-19 vaccination rollout. Cases and fatalities have been steadily declining throughout 2021 which correlates with the number of people that have received the vaccination. And while this is great news, only about 60% of the U.S. adult population, and about 50% of the U.S. total population is fully vaccinated at this point. Experts suggest that at least 70% of the population must be immune in order to achieve herd immunity.
There are two paths to herd immunity, infection, and vaccines. Herd immunity can be reached when enough people in the population have recovered from a disease and have developed protective antibodies against future infection. These protective antibodies can also be attained through vaccination. Based on the expert estimations, the U.S. recently crossed over that 70% threshold of people either having immunity via infection and recovery, or by vaccination, but because of the contagious variants and the uncertainty of reinfection, they are now suggesting the target be pushed up to around 80%.
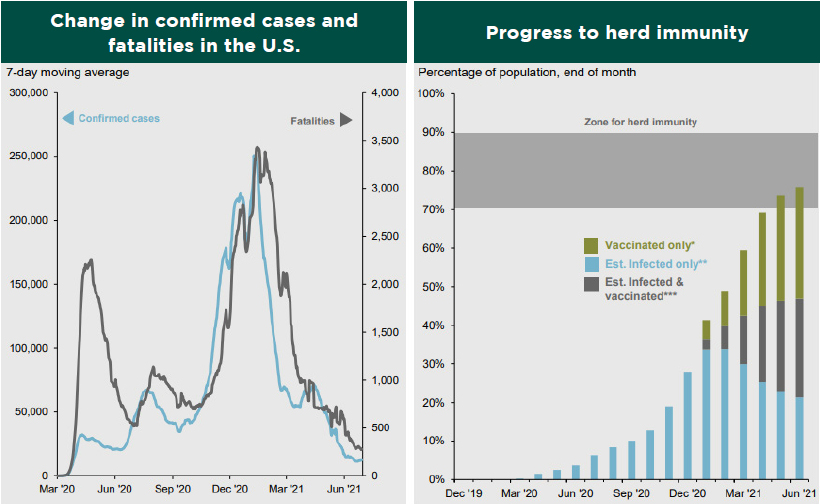
Source: Centers for Disease Control and Prevention, Johns Hopkins CSSE, Our World in Data, J.P. Morgan Asset Management. *Share of the total population that has received at least one vaccine dose. **Est. Infected represents the number of people who may have been infected by COVID-19 by using the CDC’s estimate that 1 in 4.6 COVID-19 infections were reported. ***Est. Infected & vaccinated assumes those infected equally likely to be vaccinated as those not infected. On 5/6/21, we moved up our threshold for herd immunity from 60-80% to 70-90% based on the comments by Dr. Anthony Fauci that the prevalence of more contagious variants have pushed up the target herd immunity threshold for the U.S. Guide to the Markets — U.S. Data are as of June 30, 2021.
Another thing to watch for is the improvement in the jobs market. Employment growth continues to be restrained by lingering pandemic worries and by generous federal unemployment benefits. Many believe these enhanced benefits have outweighed the incentive for people to get back to work. The good news is that roughly 26 states, accounting for more than 40% of U.S. workers, recently ended those enhanced benefits, while the benefits will expire for everyone else in September. These trends should eliminate most of the current distortions in the labor market, potentially allowing the unemployment rate to fall below 5% by the fourth quarter of this year.
Civilian unemployment rate and annualized y/2y growth for private production and non-supervisory workers
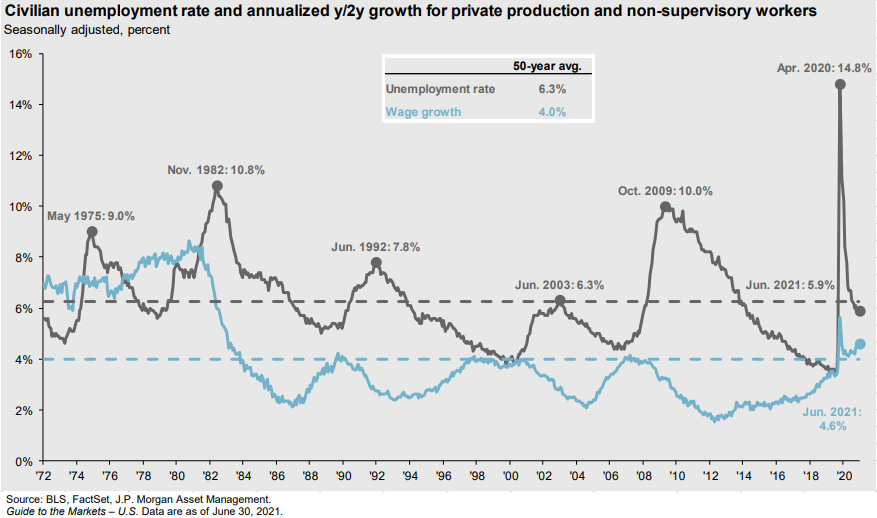
A third thing to monitor is the effects of inflation, which will likely continue to dominate the market narrative through the remainder of the year. Pent-up consumer demand, supportive fiscal and monetary policy, improving business confidence, favorable credit conditions, and reopening momentum provide all the ingredients for higher growth and higher inflation. Not to mention employers are paying higher wages to entice potential workers, and that added cost is sometimes being passed along to the consumer. To top it off, supply shortages caused by the pandemic have also led to increased prices on a variety of goods, although this should be temporary as more people get back to work and the world gets back to normal.
As Greystone mentioned in last quarter’s piece however, modest inflation is not necessarily bad for the economy. When the supply of money is greater than the demand of money, inflation can incur. With all the stimulus money that has been pumped into the economy lately, it should be no surprise that there is an increase in inflation. It can be viewed as a positive when it helps boost consumer demand and helps drive economic growth.
WITH THAT BEING SAID, GREYSTONE DOES NOT WANT TO SEE INFLATION GET OUT OF HAND. BUT THE FED CONTINUES TO ASSERT THAT THE RISE IN INFLATION AS THE PANDEMIC WINDS DOWN IS TRANSITORY AND THEREFORE SHOULD NOT PROMPT ANY CHANGES TO INTEREST RATE POLICY. WHILE TRANSIENT INFLATION AND LABOR MARKET SLACK SHOULD SUPPORT THE FED’S NEAR ZERO POLICY RATE STANCE AT LEAST UNTIL SOMETIME IN LATE 2022 OR EARLY 2023, A RAPIDLY IMPROVING ECONOMY WILL LIKELY CAUSE A CHANGE OF TUNE REGARDING ITS BOND PURCHASE PROGRAM LATER THIS YEAR.
To gauge inflation risk and whether it could become more permanent, we can look at a couple of data points. The chart below displays the output gap. This compares potential GDP with actual GDP. If the gap narrows faster than expected, the risk of inflation staying elevated becomes much more real. The slack in the labor market suggests the output gap won’t be closing earlier than expected.
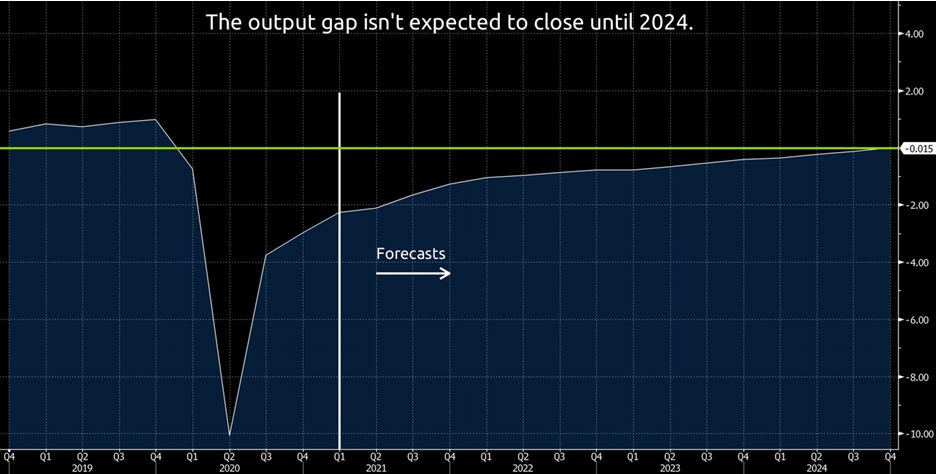
Source: Bloomberg
Another data point we can monitor is the velocity of money. This is the ratio of GDP to the money supply. It essentially tells us how quickly money is being spent. It is currently near record lows. While it will likely pick up over the remainder of the year, there is a lot of room to run before it becomes problematic.
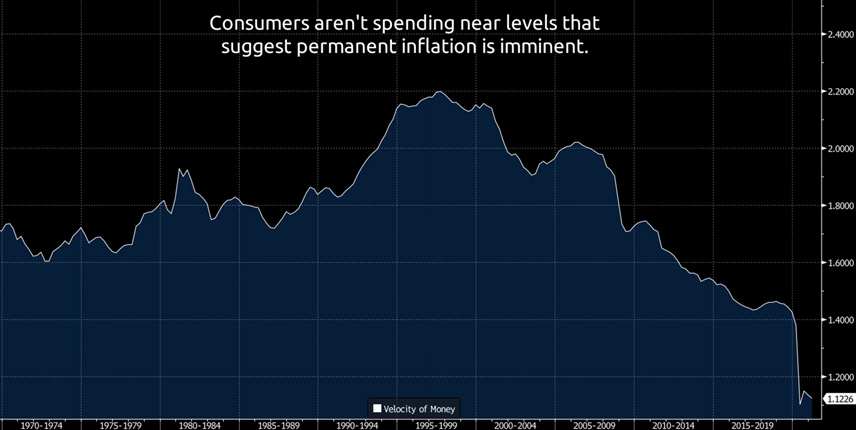
Source: Bloomberg
IN CONCLUSION
While these are just some of the things Greystone’s Investment Team is monitoring that could have an adverse effect on the market, we are optimistic about the continued speed we are witnessing to fully recover from this once-in-a-lifetime pandemic. The U.S. economic expansion has been accelerating and should remain at a strong pace for the rest of the year. The population continues to get vaccinated and more and more people are getting back to work. With record GDP numbers expected for 2021, forecasts for improving economic growth and corporate earnings, and stocks trading at or near their all-time highs, there is a good possibility that the second half of the year could maintain the positive momentum we saw in the first half.
PLEASE SPEAK WITH YOUR WEALTH ADVISOR IF YOU HAVE ANY QUESTIONS OR WANT TO REVIEW YOUR PORTFOLIO TO BE SURE THAT YOU ARE IN THE MOST APPROPRIATE STRATEGY TO HELP YOU ACCOMPLISH YOUR LONG-TERM GOALS.
SINCERELY,
THE INVESTMENT TEAM AT
GREYSTONE FINANCIAL GROUP
DISCLOSURES
There is no guarantee investment strategies will be successful. Investing involves risks including possible loss of principal. There is always the risk that an investor may lose money. A long-term investment approach cannot guarantee a profit.
All expressions of opinion are subject to change. This article is distributed for educational purposes, and it is not to be construed as an offer, solicitation, recommendation, or endorsement of any particular security, products, or services. Investors should talk to their Wealth Advisor prior to making any investment decision.

